matplotlib基础——令画图时显示中文的方法
2017-07-21 14:38
736 查看
当前代码
# -*- coding:utf-8 -*-

import matplotlib.pyplot as plt

decisionNode = dict(boxstyle="sawtooth", fc="0.8")
leafNode = dict(boxstyle="round4", fc="0.8")
arrow_args = dict(arrowstyle="<-")

def plotNode(nodeTxt, centerPt, parentPt, nodeType):
createPlot.axl.annotate(nodeTxt, xy=parentPt, xycoords='axes fraction',
xytext=centerPt, textcoords='axes fraction',
va='center', ha='center', bbox=nodeType,
arrowprops=arrow_args)

def createPlot():
fig = plt.figure(1, facecolor='white')
fig.clf()
createPlot.axl = plt.subplot(111, frameon=False)
plotNode(U'决策节点', (0.5, 0.1), (0.1, 0.5), decisionNode)
plotNode(U'叶节点', (0.8, 0.1), (0.3, 0.8), leafNode)
plt.show()

createPlot()
生成图片

改进方法
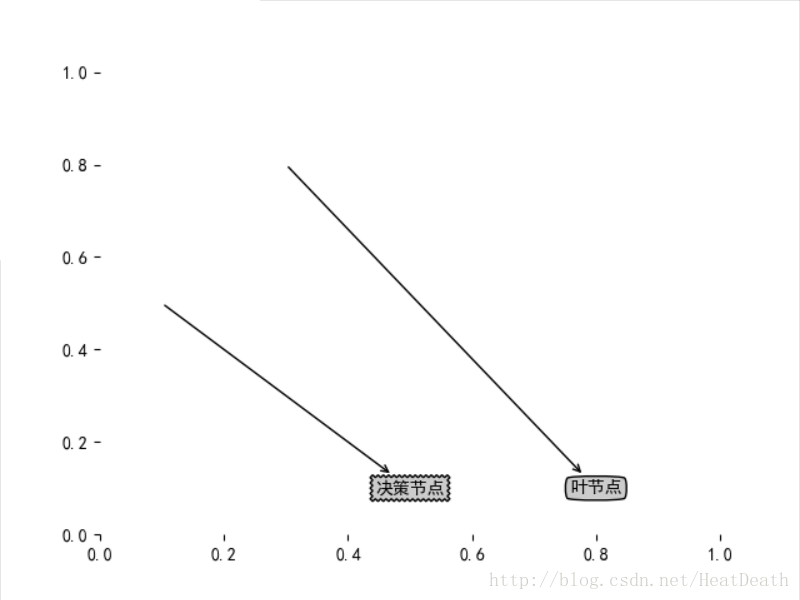
# -*- coding:utf-8 -*-

import matplotlib.pyplot as plt

# ---------------------------
# 添加以下内容
from pylab import *

mpl.rcParams['font.sans-serif'] = ['SimHei']
# ---------------------------

decisionNode = dict(boxstyle="sawtooth", fc="0.8")
leafNode = dict(boxstyle="round4", fc="0.8")
arrow_args = dict(arrowstyle="<-")

def plotNode(nodeTxt, centerPt, parentPt, nodeType):
createPlot.axl.annotate(nodeTxt, xy=parentPt, xycoords='axes fraction',
xytext=centerPt, textcoords='axes fraction',
va='center', ha='center', bbox=nodeType,
arrowprops=arrow_args)

def createPlot():
fig = plt.figure(1, facecolor='white')
fig.clf()
createPlot.axl = plt.subplot(111, frameon=False)
plotNode(U'决策节点', (0.5, 0.1), (0.1, 0.5), decisionNode)
plotNode(U'叶节点', (0.8, 0.1), (0.3, 0.8), leafNode)
plt.show()

createPlot()
生成图片

相关文章推荐
- Python 3下Matplotlib画图中文显示乱码的解决方法
- 基于Linux系统中python matplotlib画图的中文显示问题的解决方法
- python的matplotlib画图时无法显示中文的解决方法
- Python 3下Matplotlib画图中文显示乱码的解决方法
- matplotlib中画图显示中文,但保存为图片后中文乱码
- python中matplotlib画图中文不能显示
- matplotlib中文无法显示的解决方法
- 解决matplotlib画图显示中文的问题
- python画图包seaborn和matplotlib中文字体显示(针对windows系统,,使用ipython notebook)
- matplotlib画图标签显示中文问题
- Python实现matplotlib显示中文的方法详解
- Python使用matplotlib绘图无法显示中文问题的解决方法
- Python matplotlib画图的中文显示问题
- 简记matplotlib中文显示方法
- 简记matplotlib中文显示方法
- matplotlib画图标签显示中文问题
- Python matplotlib 画图窗口显示到gui或者控制台的方法
- matplotlib不能显示中文的解决方法
- Ubuntu下matplotlib中文无法显示的解决方法
- 解决sea_born和matplotlib画图中文显示的问题