matplotlib设置轴标签
2017-11-26 12:59
369 查看
# -*- coding: utf-8 -*-
import numpy as np
import matplotlib.pyplot as plt
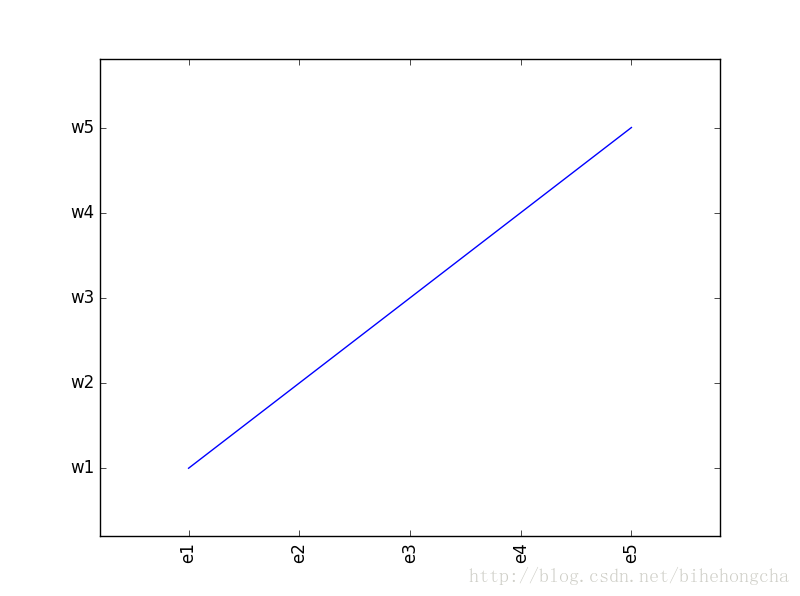
def x_y_axis_labeling(x,y,x_label,y_label,figure_no):
#设置图片生成顺序figure_no
plt.figure(figure_no)
plt.plot(x,y)
plt.margins(0.2)
#rotatio设置文章标签方向
plt.xticks(x,x_label,rotation='vertical')
plt.yticks(y,y_label,)
if __name__=='__main__':
plt.close('all')
x=np.arange(1,6)
y=np.arange(100,600,100)
print(y)
x_label=['e1','e2','e3','e4','e5']
#x_label=x
y_label=['w1','w2','w3','w4','w5']
#y_label=y
x_y_axis_labeling(x,y,x_label,y_label,1)
import numpy as np
import matplotlib.pyplot as plt
def x_y_axis_labeling(x,y,x_label,y_label,figure_no):
#设置图片生成顺序figure_no
plt.figure(figure_no)
plt.plot(x,y)
plt.margins(0.2)
#rotatio设置文章标签方向
plt.xticks(x,x_label,rotation='vertical')
plt.yticks(y,y_label,)
if __name__=='__main__':
plt.close('all')
x=np.arange(1,6)
y=np.arange(100,600,100)
print(y)
x_label=['e1','e2','e3','e4','e5']
#x_label=x
y_label=['w1','w2','w3','w4','w5']
#y_label=y
x_y_axis_labeling(x,y,x_label,y_label,1)

相关文章推荐
- 在matplotlib的图中设置中文标签
- 用matplotlib设置标题、轴标签、刻度标签以及添加图例
- 演示MatPlotLib中如何设置坐标轴主刻度标签和次刻度标签
- python matplotlib 中文显示参数设置
- python matplotlib 任意位置和字符串 ticket 设置
- matplotlib的基本用法(六)——设置坐标轴label
- matplotlib设置坐标轴
- pylab/matplotlib 日期标签控制
- python matplotlib 中文显示参数设置
- matplotlib学习之设置线条颜色、形状
- Matplotlib 中文用户指南 4.8 XeLaTeX/LuaLaTeX 设置
- 设置matplotlib 横坐标为毫秒
- 【Matplotlib】线设置,坐标显示范围
- Matplotlib解决中文标签问题
- python—matplotlib数据可视化实例注解系列-----之plot图线型设置
- python调用Matplotlib绘制分布点并且添加标签
- matplotlib subplots 设置每个子图的x轴的标号
- matplotlib画图时的中文设置
- 【Matplotlib】绘图常见设置说明