matplotlib绘制折线图与散点图
2017-11-26 11:09
841 查看
# -*- coding: utf-8 -*-
import numpy as np
import matplotlib.pyplot as plt
#折线图,figure_no表示显示图的顺序
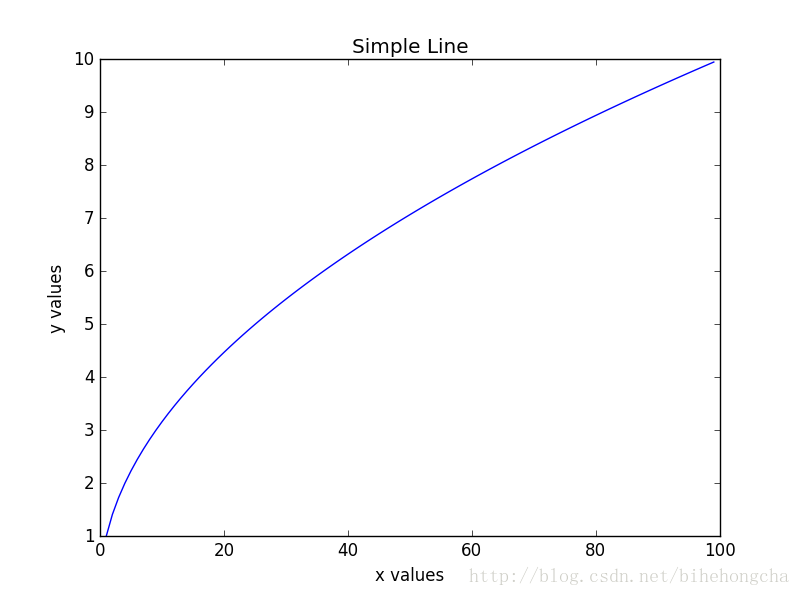
def simple_line_plot(x,y,figure_no):
plt.figure(figure_no)
plt.plot(x,y)
plt.xlabel('x values')
plt.ylabel('y values')
plt.title('Simple Line')
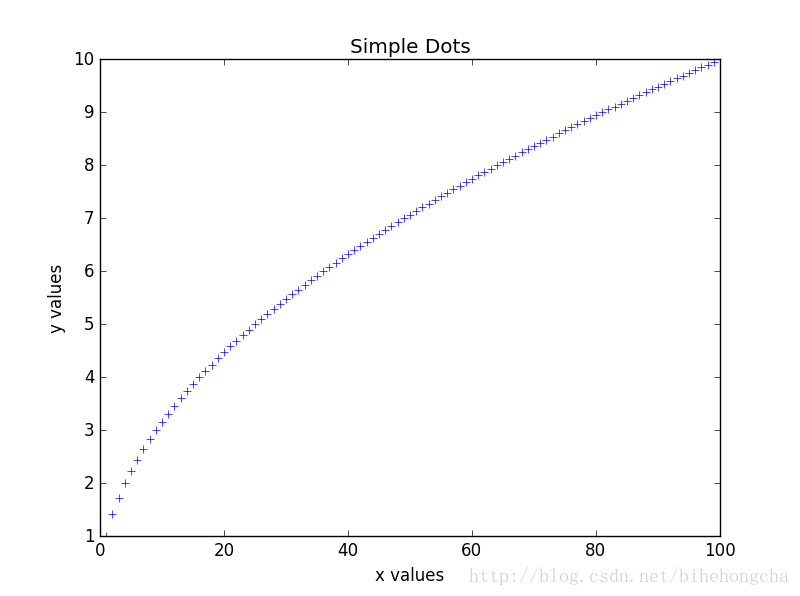
def simple_dots(x,y,figure_no):
plt.figure(figure_no)
#设置线的形状为+,颜色为b蓝色
plt.plot(x,y,'+b')
plt.xlabel('x values')
plt.ylabel('y values')
plt.title('Simple Dots')
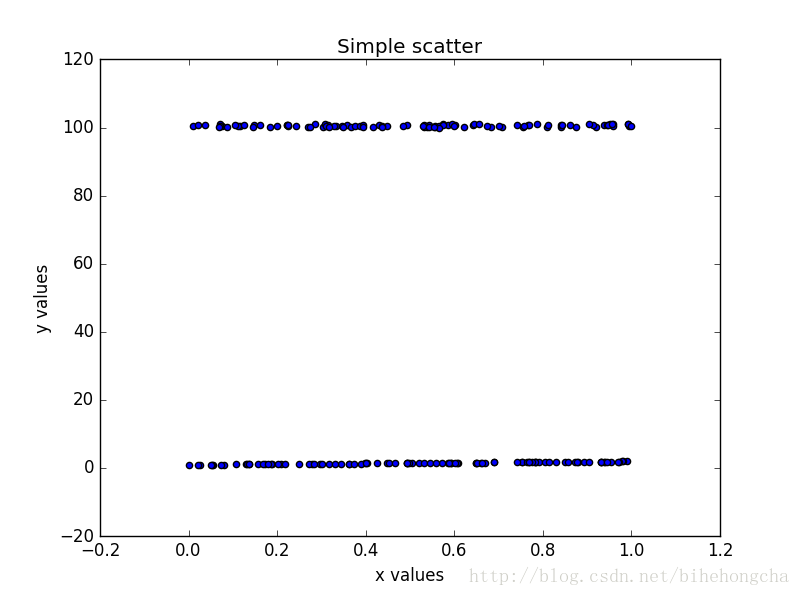
#散点图
def simple_scatter(x,y,figure_no):
plt.figure(figure_no)
plt.scatter(x,y)
plt.xlabel('x values')
plt.ylabel('y values')
plt.title('Simple scatter')
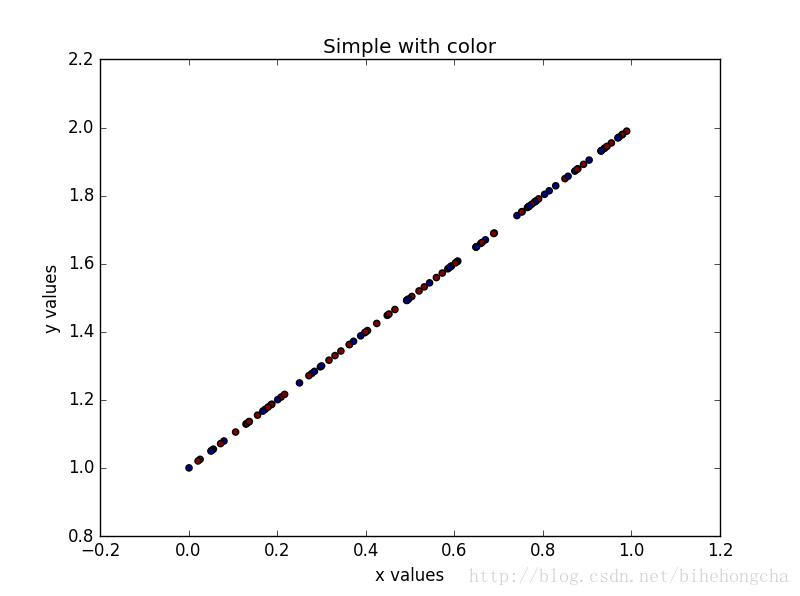
def scatter_with_color(x,y,labels,figure_no):
plt.figure(figure_no)
#设置不同颜色
plt.scatter(x,y,c=labels)
plt.xlabel('x values')
plt.ylabel('y values')
plt.title('Simple with color')
if __name__=="__main__":
#清除之前的图片
plt.close('all')
x=np.arange(1,100,dtype=float)
#y=np.array([np.power(xx,2) for xx in x])
y=np.sqrt(x)
figure_no=1
simple_line_plot(x,y,figure_no)
figure_no+=1
simple_dots(x,y,figure_no)
x=np.random.uniform(size=100)
#y=np.random.uniform(size=100)
y=x+1
x1=np.random.uniform(size=100)
#y=np.random.uniform(size=100)
y1=x+100
figure_no+=1
simple_scatter(x,y,figure_no)
simple_scatter(x1,y1,figure_no)
figure_no+=1
#参生100个随机的0或1,设置颜色
label=np.random.randint(2,size=100)
scatter_with_color(x,y,label,figure_no)
plt.show()
import numpy as np
import matplotlib.pyplot as plt
#折线图,figure_no表示显示图的顺序
def simple_line_plot(x,y,figure_no):
plt.figure(figure_no)
plt.plot(x,y)
plt.xlabel('x values')
plt.ylabel('y values')
plt.title('Simple Line')
def simple_dots(x,y,figure_no):
plt.figure(figure_no)
#设置线的形状为+,颜色为b蓝色
plt.plot(x,y,'+b')
plt.xlabel('x values')
plt.ylabel('y values')
plt.title('Simple Dots')
#散点图
def simple_scatter(x,y,figure_no):
plt.figure(figure_no)
plt.scatter(x,y)
plt.xlabel('x values')
plt.ylabel('y values')
plt.title('Simple scatter')
def scatter_with_color(x,y,labels,figure_no):
plt.figure(figure_no)
#设置不同颜色
plt.scatter(x,y,c=labels)
plt.xlabel('x values')
plt.ylabel('y values')
plt.title('Simple with color')
if __name__=="__main__":
#清除之前的图片
plt.close('all')
x=np.arange(1,100,dtype=float)
#y=np.array([np.power(xx,2) for xx in x])
y=np.sqrt(x)
figure_no=1
simple_line_plot(x,y,figure_no)
figure_no+=1
simple_dots(x,y,figure_no)
x=np.random.uniform(size=100)
#y=np.random.uniform(size=100)
y=x+1
x1=np.random.uniform(size=100)
#y=np.random.uniform(size=100)
y1=x+100
figure_no+=1
simple_scatter(x,y,figure_no)
simple_scatter(x1,y1,figure_no)
figure_no+=1
#参生100个随机的0或1,设置颜色
label=np.random.randint(2,size=100)
scatter_with_color(x,y,label,figure_no)
plt.show()

相关文章推荐
- python matplotlib从文件中读取数据绘制散点图
- Python开发【模块】:matplotlib 绘制折线图
- Python+matplotlib绘制不同大小和颜色散点图实例
- 使用matplotlib绘制散点图
- matplotlib入门-绘制简单折线图
- matplotlib学习之scatter函数--绘制散点图
- python matplotlib模块——绘制三维图形、三维数据散点图
- python使用matplotlib绘制折线图教程
- python使用matplotlib绘制折线图教程
- python3机器学习实战 kNN实现+matplotlib绘制散点图
- 使用matplotlib绘制散点图
- Python使用matplotlib绘制余弦的散点图示例
- Python 3基础教程48-Matplotlib绘制散点图和柱状图
- matplotlib绘制散点图
- [转]用Matplotlib绘制 折线图 散点图 柱状图 圆饼图
- wxPython+Matplotlib绘制折线图表
- python matplotlib模块——绘制三维图形、三维数据散点图
- matplotlib 散点图绘制
- matplotlib的基本用法(七)——绘制散点图
- 使用matplotlib绘制简单的折线图