pylab/matplotlib 日期标签控制
2013-08-26 17:50
169 查看
今天遇到了同样的问题,经过搜索,搜到下面这篇文章
Today I struggled a bit with
pylab's plot_date function and overlapping date tick labels:
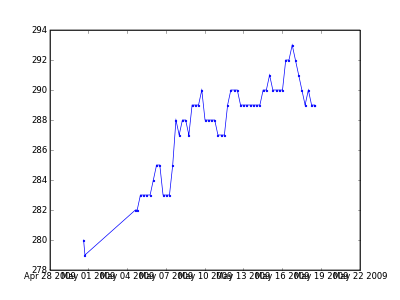
After some googling, I found that pylab offers
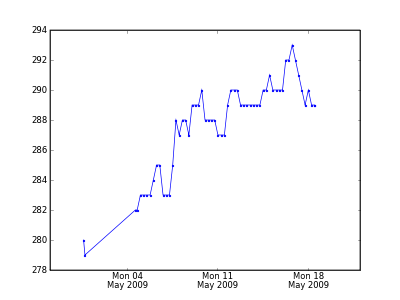
nice flexible date tick control and formatting. I added a date tick locator and a date formatter to the mix as follows:
and now I have this plot
转自:http://stefaanlippens.net/pylab_date_tick_control
Today I struggled a bit with
pylab's plot_date function and overlapping date tick labels:
After some googling, I found that pylab offers
nice flexible date tick control and formatting. I added a date tick locator and a date formatter to the mix as follows:
import pylab
import matplotlib
import matplotlib.dates

fig = pylab.figure()
ax = fig.gca()

# Plotting stuff here ...
ax.plot_date(dates, values, 'b.-')

# Set major x ticks on Mondays.
ax.xaxis.set_major_locator(
matplotlib.dates.WeekdayLocator(byweekday=matplotlib.dates.MO)
)
ax.xaxis.set_major_formatter(
matplotlib.dates.DateFormatter('%a %d\n%b %Y')
)
and now I have this plot
转自:http://stefaanlippens.net/pylab_date_tick_control

相关文章推荐
- matplotlib命令与格式:tick坐标轴日期格式(设置日期主副刻度)
- python中matplotlib的颜色及线条控制
- matplotlib 中文标签乱码问题
- Python:matplotlib画图----如何控制画图范围,如何画两条曲线间的阴影,如何控制Y轴现实范围
- 控制 matplotlib 子图大小
- matplotlib画图标签显示中文问题
- Python 3基础教程45-Matplotlib添加标签和标题描述
- python中matplotlib的颜色及线条控制【以及改变legend字体大小】
- Python调用Matplotlib绘制分布点并且添加标签
- Matplotlib 绘图双纵坐标轴设置及控制设置时间格式
- python中matplotlib的颜色及线条控制
- Python及其接口函数库(TensorFlow、NumPy、Matplotlib、sklearn、pandas)参考资料(更新中,更新日期:2017-07-10)
- python画图matplotlib的Legend(显示图中的标签)
- python中matplotlib的颜色及线条控制
- matplotlib画图标签显示中文问题
- matplotlib命令与格式:坐标轴数值格式(日期格式,百分比,科学记数)
- Python学习笔记:Matplotlib图像属性控制
- 用matplotlib设置标题、轴标签、刻度标签以及添加图例
- Python高级数据处理与可视化(三)---- Matplotlib图像属性控制 & Pandas作图
- 在matplotlib的图中设置中文标签