Python利用matplotlib做图中图及次坐标轴的实例
2019-07-08 09:35
1126 查看
图中图
准备数据
import matplotlib.pyplot as plt

fig = plt.figure()
x = [1, 2, 3, 4, 5, 6, 7]
y = [1, 3, 4, 2, 5, 8, 6]
- 大图
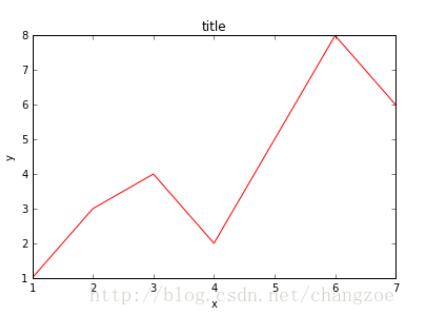
首先确定大图左下角的位置以及宽高:
注意,4个值都是占整个figure坐标系的百分比。在这里,假设figure的大小是10x10,那么大图就被包含在由(1, 1)开始,宽8,高8的坐标系内。
# below are all percentage
left, bottom, width, height = 0.1, 0.1, 0.8, 0.8
ax1 = fig.add_axes([left, bottom, width, height]) # main axes
ax1.plot(x, y, 'r')
ax1.set_xlabel('x')
ax1.set_ylabel('y')
ax1.set_title('title')
将大图坐标系添加到figure中,颜色为r(red),取名为title:
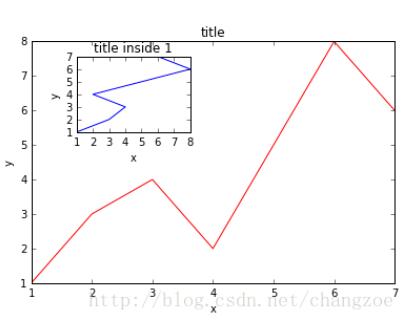
- 小图
接着,我们来绘制左上角的小图,步骤和绘制大图一样,注意坐标系位置和大小的改变
ax2 = fig.add_axes([0.2, 0.6, 0.25, 0.25]) # inside axes
ax2.plot(y, x, 'b')
ax2.set_xlabel('x')
ax2.set_ylabel('y')
ax2.set_title('title inside 1')
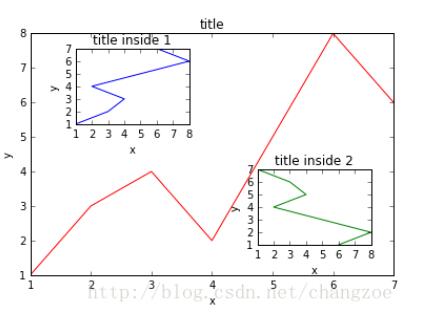
最后,我们来绘制一个右下角的小图。这里我们采用一种更简单方法,即直接往plt里添加新的坐标系
# different method to add axes
####################################
plt.axes([0.6, 0.2, 0.25, 0.25])
plt.plot(y[::-1], x, 'g')
plt.xlabel('x')
plt.ylabel('y')
plt.title('title inside 2')
注意对y进行了逆序处理
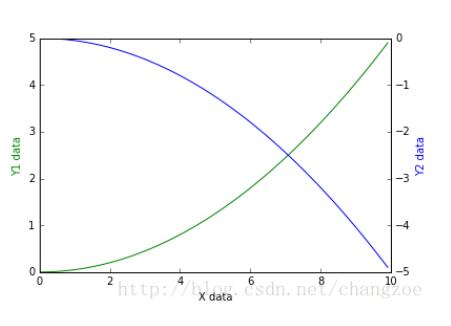
次坐标轴
有时候我们会用到次坐标轴,即在同个图上有第2个y轴存在。同样可以用matplotlib做到
第一个Y 坐标
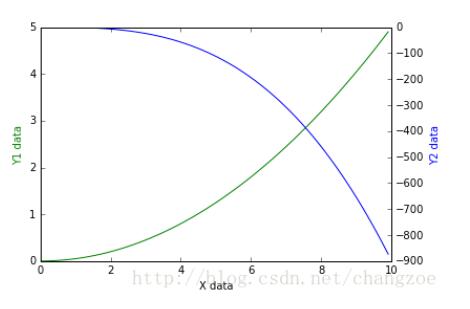
import matplotlib.pyplot as plt
import numpy as np

x = np.arange(0, 10, 0.1)
y1 = 0.05 * x**2
y2 = -1 *y1

fig, ax1 = plt.subplots()
第二个坐标轴
对ax1调用twinx()方法,生成如同镜面效果后的ax2
接着进行绘图, 将 y1, y2 分别画在 ax1, ax2 上:
ax2 = ax1.twinx()  # mirror the ax1
ax1.plot(x, y1, 'g-')
ax2.plot(x, y2, 'b-')

ax1.set_xlabel('X data')
ax1.set_ylabel('Y1 data', color='g')
ax2.set_ylabel('Y2 data', color='b')

plt.show()
同理:改变y2生成图像
以上这篇Python利用matplotlib做图中图及次坐标轴的实例就是小编分享给大家的全部内容了,希望能给大家一个参考
您可能感兴趣的文章:

相关文章推荐
- python中利用matplotlib.patches在一个坐标轴上添加画的图形
- Python 利用matplotlib绘制热力图 correlation heatmap X,Y 坐标轴字体重叠显示问题,将字体进行旋转
- Python利用matplotlib.pyplot绘图时如何设置坐标轴刻度
- 对python中Matplotlib的坐标轴的坐标区间的设定实例讲解
- Python利用matplotlib做图中图及次坐标轴
- python matplotlib绘图,修改坐标轴刻度为文字的实例
- python—matplotlib数据可视化实例注解系列-----之函数图
- python+matplotlib实现礼盒柱状图实例代码
- Python的地形三维可视化Matplotlib和gdal使用实例
- python matplotlib坐标轴设置的方法
- 利用python numpy+matplotlib绘制股票k线图的方法
- 7057-1.Python数据可视化:利用matplotlib中的subplot进行图中图展示
- python—matplotlib数据可视化实例注解系列-----之横条图
- 批量下载matplotlib网站实例源码python脚本
- 利用matplotlib在python上绘制3D散点图
- python matplotlib绘图设置坐标轴刻度、文本
- matplotlib在python上绘制3D散点图实例详解
- Python利用matplotlib生成图片背景及图例透明的效果
- Python使用matplotlib模块绘制图像并设置标题与坐标轴等信息示例
- python35 利用matplotlib的subplot画多幅图