利用百度echarts实现图表功能简单入门示例【附源码下载】
2019-06-10 11:24
981 查看
本文实例讲述了利用百度echarts实现图表功能。分享给大家供大家参考,具体如下:
百度有一款开源的图表控件,号称是大数据时代最好的图表控件。刚好目前的项目需要用图表展示给客户看数据,所以就选择这个三方的控件。对这种控件一般来说使用起来应该没有太大的难度,基本就是按照它的规则组装json数据,关键是配置上面, 如果刚开始入门,不太懂,可能真要花点时间来搞的。我整理了一个最基本的入门例子,里面有详细的注释,按这种方式去加载相关 js 就没有问题了:
<!DOCTYPE html>
<head>
<meta charset="GBK">
<title>ECharts</title>
</head>
<body>
<!-- 为ECharts准备一个具备大小(宽高)的Dom -->
<div id="main" style="height:400px"></div>
<!-- 功能测试 -->
<!-- ECharts单文件引入 -->
<script src="./js/echarts.js"></script>
<script type="text/javascript">
// 路径配置
require.config({
paths: {
echarts: './js'
}
});
// 使用
require(
[
'echarts',
'echarts/chart/bar' // 使用柱状图就加载bar模块,按需加载
],
function (ec) {
// 基于准备好的dom,初始化echarts图表
var myChart = ec.init(document.getElementById('main'));
var option = {
tooltip : {
trigger: 'axis',
axisPointer : { // 坐标轴指示器,坐标轴触发有效
type : 'shadow' // 默认为直线,可选为:'line' | 'shadow'
}
},
legend: {
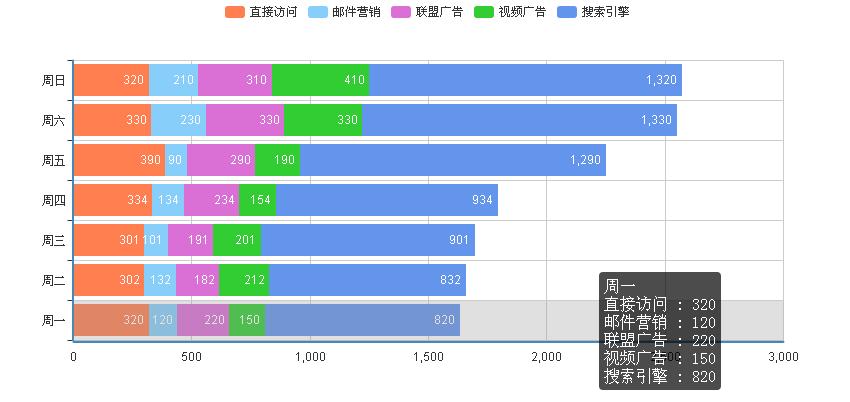
data:['直接访问', '邮件营销','联盟广告','视频广告','搜索引擎']
},
toolbox: {
show : false,
feature : {
mark : {show: true},
dataView : {show: true, readOnly: false},
magicType : {show: true, type: ['line', 'bar', 'stack', 'tiled']},
restore : {show: true},
saveAsImage : {show: true}
}
},
calculable : true,
xAxis : [
{
type : 'value'
}
],
yAxis : [
{
type : 'category',
data : ['周一','周二','周三','周四','周五','周六','周日']
}
],
series : [
{
name:'直接访问',
type:'bar',
stack: '总量',
itemStyle : { normal: {label : {show: true, position: 'insideRight'}}},
data:[320, 302, 301, 334, 390, 330, 320]
},
{
name:'邮件营销',
type:'bar',
stack: '总量',
itemStyle : { normal: {label : {show: true, position: 'insideRight'}}},
data:[120, 132, 101, 134, 90, 230, 210]
},
{
name:'联盟广告',
type:'bar',
stack: '总量',
itemStyle : { normal: {label : {show: true, position: 'insideRight'}}},
data:[220, 182, 191, 234, 290, 330, 310]
},
{
name:'视频广告',
type:'bar',
stack: '总量',
itemStyle : { normal: {label : {show: true, position: 'insideRight'}}},
data:[150, 212, 201, 154, 190, 330, 410]
},
{
name:'搜索引擎',
type:'bar',
stack: '总量',
itemStyle : { normal: {label : {show: true, position: 'insideRight'}}},
data:[820, 832, 901, 934, 1290, 1330, 1320]
}
]
};
// 为echarts对象加载数据
myChart.setOption(option);
// 根据窗口自动缩放
window.onresize = myChart.resize;
// 绑定事件测试
var ecConfig = require('echarts/config');
myChart.on(ecConfig.EVENT.CLICK, function(param){
// 需要的参数都可以从这里面获取.
alert(param);
})
}
);
</script>
</body>
整个例子代码下载,包含了百度 echarts包.
完整实例代码点击此处本站下载。
更多关于JavaScript相关内容感兴趣的读者可查看本站专题:《JavaScript字符与字符串操作技巧总结》、《JavaScript数学运算用法总结》、《JavaScript中json操作技巧总结》、《JavaScript切换特效与技巧总结》、《JavaScript查找算法技巧总结》、《JavaScript错误与调试技巧总结》、《JavaScript数据结构与算法技巧总结》及《JavaScript遍历算法与技巧总结》
希望本文所述对大家JavaScript程序设计有所帮助。
您可能感兴趣的文章:

相关文章推荐
- JS实现的简单拖拽购物车功能示例【附源码下载】
- JS中简单的实现像C#中using功能(有源码下载)
- jQuery插件echarts实现的去掉X轴、Y轴和网格线效果示例【附demo源码下载】
- jQuery插件echarts实现的多柱子柱状图效果示例【附demo源码下载】
- 利用python实现简单的循环购物车功能示例代码
- 利用jQuery简单实现产品展示图片左右滚动功能(示例代码)
- 利用URL实现简单下载网页的功能
- 实现node端渲染图表极速系统踩高频踩网站开发源码下载平台出租出售的简单方案
- SSM框架整合,SSM简单应用,SSM实现增删查改,SSM入门,SSM整合源码下载
- Python实现的下载网页源码功能示例
- 用echarts实现一个简单的生成图表的功能
- SSM框架整合,SSM简单应用,SSM实现增删查改,SSM入门,SSM整合源码下载(转)
- jQuery插件实现的日历功能示例【附源码下载】
- 通过百度echarts实现数据图表展示功能
- 通过百度echarts实现数据图表展示功能
- 利用jQuery简单实现产品展示图片左右滚动功能(示例代码)
- jQuery插件echarts实现的循环生成图效果示例【附demo源码下载】
- 微信小程序实现点击按钮修改view标签背景颜色功能示例【附demo源码下载】
- jQuery插件Echarts实现的双轴图效果示例【附demo源码下载】
- jQuery实现带右侧索引功能的通讯录示例【附源码下载】