【小松教你手游开发】【unity实用技能】内存调试方法
2018-03-10 16:13
417 查看
转自:http://blog.theknightsofunity.com/profiling-unity-application-profiler-samples/
The Unity Profiler Samples is something that most of Unity users are unaware of. Yet it can be extremely helpful if you want to find out what amount of resources your code takes during the execution.
If you’re already familiar with built-in profiler then you might know that by default it is not profiling all method calls. Also, the Deep Profiling causes large overhead that will significantly slow down your application execution and it even may not be possible to perform the profiling activity at all (Unity can run out of memory). The Profiler Samplesare quite useful here.
Profiler Sample is a block of code that starts with Profiler.BeginSample()and ends with Profiler.EndSample() calls. Just like this:
Normally, you would put it before and after the chunk of code that you want to be profiled. Profiler Sample will record the execution time for you and it will be displayed in the Profiler window without the need to use the Deep Profiling.
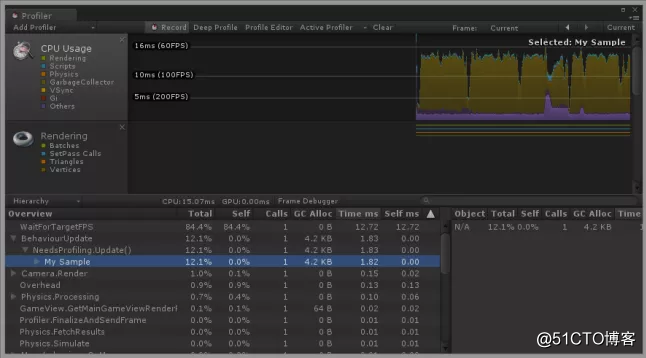
As you can see, there’s a new entry in the Profiler Hierarchy!
Of course you can add as many Profiler Samples as you want. It’s completely up to you! Don’t worry about adding too many samples. These calls have zero overhead when they are deployed in non-development build.
The Unity Profiler Samples is something that most of Unity users are unaware of. Yet it can be extremely helpful if you want to find out what amount of resources your code takes during the execution.
If you’re already familiar with built-in profiler then you might know that by default it is not profiling all method calls. Also, the Deep Profiling causes large overhead that will significantly slow down your application execution and it even may not be possible to perform the profiling activity at all (Unity can run out of memory). The Profiler Samplesare quite useful here.
Profiler Sample is a block of code that starts with Profiler.BeginSample()and ends with Profiler.EndSample() calls. Just like this:
using UnityEngine;
public class NeedsProfiling : MonoBehaviour
{
void Update() {
Profiler.BeginSample("My Sample");
Debug.Log("This code is beign profiled");
Profiler.EndSample();
}
}
Normally, you would put it before and after the chunk of code that you want to be profiled. Profiler Sample will record the execution time for you and it will be displayed in the Profiler window without the need to use the Deep Profiling.
As you can see, there’s a new entry in the Profiler Hierarchy!
Of course you can add as many Profiler Samples as you want. It’s completely up to you! Don’t worry about adding too many samples. These calls have zero overhead when they are deployed in non-development build.

相关文章推荐
- 【小松教你手游开发】【unity实用技能】unity 内存调试方法
- 【小松教你手游开发】【unity实用技能】Unity内存申请和释放(转自tnqiang)
- 【小松教你手游开发】【unity实用技能】Unity Mesh更新的时候增加内存
- 【小松教你手游开发】【unity实用技能】ios接sdk,c++ 交叉引用解决方法
- 【小松教你手游开发】【unity实用技能】unity性能问题查找方法
- 【小松教你手游开发】【unity实用技能】Unity3D_NGUI_性能优化实践_CPU卡顿
- 【小松教你手游开发】【unity实用技能】u3d 层次问题总结
- 【小松教你手游开发】【unity实用技能】控制renderQueue解决NGUI与Unity3D物体渲染顺序问题
- 【小松教你手游开发】【unity实用技能】InvalidOperationException: out of sync
- 【小松教你手游开发】【unity实用技能】unity发包优化(android一键发包)
- 【小松教你手游开发】【unity实用技能】对象的简单平移与旋转
- 【小松教你手游开发】【unity实用技能】NGUI字体描边
- 【小松教你手游开发】【unity实用技能】Unity项目内存优化大全
- 【小松教你手游开发】【unity实用技能】unity ngui wp8上使用动态字体消失或碎片化的问
- 【小松教你手游开发】【unity实用技能】从NGUI的UIScrollview的实现原理延伸到ngui的层次,合并,drawcall生成原理
- 【小松教你手游开发】【unity实用技能】一键改变UI字体
- 【小松教你手游开发】【unity实用技能】unity所有特殊文件夹的用途(转自雨松momo)
- 【小松教你手游开发】【unity实用技能】Unity3D中Assetbundle技术使用心得
- 【小松教你手游开发】【unity实用技能】重置scrollpanel
- 【小松教你手游开发】【unity实用技能】NGUI Depth探索