在UnityUI中绘制线状统计图2.0
2022-04-10 16:46
1331 查看
##在之前的基础上添加横纵坐标 上一期在这里:https://www.cnblogs.com/AlphaIcarus/p/16123434.html
先分别创建横纵坐标点的模板,将这两个Text放在Graphic Container之下
完成后隐藏它们

将这两个模板设为预制体也可以 修改
MyGraph
public class MyGraph : MonoBehaviour
{
......
private RectTransform labelX;	//声明一个RectTransform
private RectTransform labelY;	//声明一个RectTransform

private void Awake()
{

//graphContainer = transform.Find("GraphContainer").GetComponent<RectTransform>();
......
//因为之前把模板放在graphContainer之下,如果是设为了预制体,直接声明然后赋值就行,不需要这两句
labelX = graphContainer.Find("labelX").GetComponent<RectTransform>();	//找到X轴的模板
labelY = graphContainer.Find("labelY").GetComponent<RectTransform>();	//找到Y轴的模板
......
}

//private GameObject CreateCircle(Vector2 anchoredPosition){......}
private void ShowGraph(List<int> valueList)
{
......
for (int i = 0; i < valueList.Count; i++)
{
......
//lastPoint = circleGameobject;

RectTransform labelx = Instantiate(labelX);	//声明一个RectTransform,复制并实例化模板
//将新生成的坐标设为graphContainer子物体,这样锚点位于graphContainer左下角(原点)方便计算位置坐标
labelx.SetParent(graphContainer);
labelx.gameObject.SetActive(true);			//显示坐标,因为之前隐藏了模板
labelx.anchoredPosition = new Vector2(xPos, -25);	//设置横坐标位置
labelx.GetComponent<Text>().text = i.ToString();	//设置横坐标显示的数据
}
}
//private void DrawLine(Vector2 pointA, Vector2 pointB){......}
//private float RotateAngle(float x, float y){......}
}
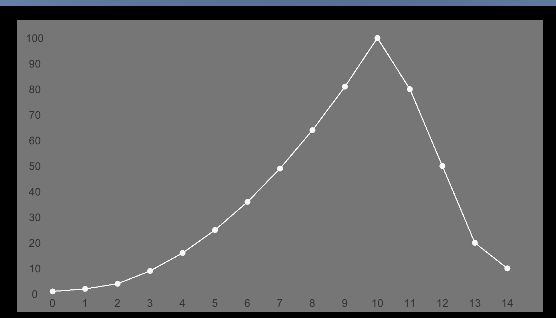
显示结果:
 这里我又把背景大小调整了一下,方便横坐标显示
接下来是y轴坐标
修改
这里我又把背景大小调整了一下,方便横坐标显示
接下来是y轴坐标
修改
MyGraph
......
private void ShowGraph(List<int> valueList)
{
......
for (int i = 0; i < valueList.Count; i++){......}

int count = 10;		//这里为y坐标个数
for (int i = 0; i <= count; i++)
{
RectTransform labely = Instantiate(labelY);	//获取模板
labely.SetParent(graphContainer);			//设置父物体
labely.gameObject.SetActive(true);			//显示
float yPos = i * 1f / count;
labely.anchoredPosition = new Vector2(-50f, yPos * graphHeight);	//y轴坐标
labely.GetComponent<Text>().text = Mathf.RoundToInt(yPos * maxValue).ToString();	//显示的值
}
}
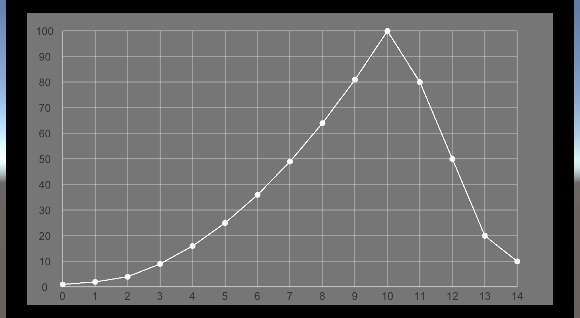
显示效果:
 接下来是横纵坐标的线
和坐标点的方法类似,分别创建横纵坐标线就行,这里两个线条都是Image,且锚点都是graphcontainer,即原点位于左下角
 然后修改
然后修改
MyGraph
public class MyGraph : MonoBehaviour
{
......
private RectTransform lineH;
private RectTransform lineV;
......
private void Awake()
{
......
lineH = graphContainer.Find("LineHorizontal").GetComponent<RectTransform>();
lineV = graphContainer.Find("LineVertical").GetComponent<RectTransform>();
......
}
private void ShowGraph(List<int> valueList)
{
......
for (int i = 0; i < valueList.Count; i++)
{
......
//在横纵坐标后面添加即可,因为位置和坐标点相同
RectTransform lineVertical = Instantiate(lineV);
lineVertical.SetParent(graphContainer, false);
lineVertical.gameObject.SetActive(true);
lineVertical.anchoredPosition = new Vector2(xPos, 0f);
}

int count = 10;
for (int i = 0; i <= count; i++)
{
......
//在横纵坐标后面添加即可,因为位置和坐标点相同
RectTransform lingHorizontal = Instantiate(lineH);
lingHorizontal.SetParent(graphContainer, false);
lingHorizontal.gameObject.SetActive(true);
lingHorizontal.anchoredPosition = new Vector2(-0f, yPos * graphHeight);
}
}
}
显示效果:
 线条可以自行修改透明度和颜色或者修改为虚线贴图
下一步为绘制柱状统计图:
https://www.geek-share.com/detail/2860644620.html
线条可以自行修改透明度和颜色或者修改为虚线贴图
下一步为绘制柱状统计图:
https://www.geek-share.com/detail/2860644620.html

相关文章推荐
- UnityUI绘制柱状统计图
- Unity实现UI光晕效果(发光效果)
- [UnityUI]UGUI自适应
- Unity 扇形UI 360Canvas
- 关于Unity中UI中的Mask组件、Text组件和布局
- (二)UI绘制流程-绘制过程源码分析
- ComponentArt Web.UI 2006.1 for asp.net 2.0
- Windows Mobile中实现统计图形的绘制(C#版,柱状图)
- [UnityUI]不规则图片的点击响应
- unity对游戏ui的了解一
- 【转载】Unity中Oculus VR的UI凝视交互
- Unity教程之-RenderTexture实现实时阴影绘制
- [Unity&NGUI]如何快速设置NGUI UI,Scroll Bar
- 【Unity插件】NGUI核心组件之UIPanel
- ASP.NET 2.0里轻松获取数据库连接统计数据
- [UI]实用案例--Shape绘制实用圆圈
- Java GUI:AWT、Swing、UI绘制、双缓冲技术
- MATLAB数据统计和分析:绘制统计图表
- Kinect2.0+Unity之环境搭建
- GridView页脚汇总(统计)行的方法(.net 2.0) (转)