matplotlib模块数据可视化-Annotation标注
2017-08-15 13:02
671 查看
1 说明
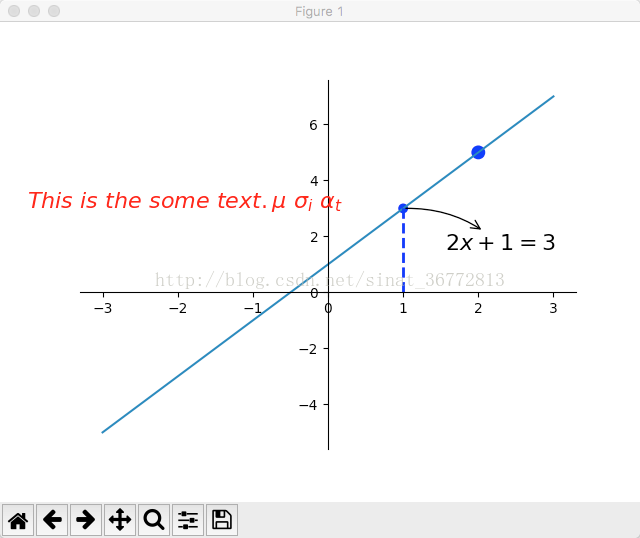
在绘制图形的时候我们有时候需要指出某些特殊的点,所以我们需要用到标注功能,对特殊点进行标记说明。2 源码
import numpy as npimport matplotlib.pyplot as plt
x = np.linspace(-3,3,50)
y1 = 2*x + 1
plt.figure()
plt.plot(x,y1)
# 移动坐标轴
ga = plt.gca()
ga.spines['right'].set_color('none')
ga.spines['top'].set_color('none')
ga.spines['bottom'].set_position(('data',0))
ga.spines['left'].set_position(('data',0))
x0 = 1;
y0 = 2*x0 + 1
plt.plot([x0,x0],[y0,0],'b--',linewidth=2)
# scatter(x, y, s=20, c='b', marker='o', cmap=None, norm=None, vmin=None, vmax=None, alpha=None, linewidths=None, verts=None, hold=None, **kwargs)
# x,y 画点的坐标可以是单点,也可以是x=[x0,2],y=[y0,5]表示多个点(x0,y0)和(2,5)坐标的散列点
# s : 缩放,默认缩放20倍 也可以(50,100),表示第一个点缩放50,第二个点缩放100,一次对应设置
# c 也可以写成 color : 点的颜色,默认是'b'蓝色,也可以写成数组cValue = ['r','y','g','b'],然后设置c=cValue
# marker : 样式。与plt.plot()的linestyle参数一样,有‘-’、'--'、'o'、'+'等
# cmap :color map
# norm : 数据亮度0.0-1.0,跟c参数有关,没看出什么效果,不太懂,
# hold : 是否显示其他内容True显示,默认为none显示,Fales不显示,只渲染散点
# alpha : 这个点的透明度0.0-1.0,0.0表示完全透明,1.0表示完全不透明(默认)
# linewidths : 设置点的圆环粗细,设置值为0,则远点没有圆环外边框
plt.scatter(x=(x0,2),y=(y0,5),s=(50,100),c='b',marker='o',linewidths=0)
# 创建一个描述 annotate(s, xy, xytext=None, xycoords='data',textcoords='data', arrowprops=None, **kwargs)
# s : 描述的内容
# xy : 加描述的点
# xytext : 标注的位置,xytext=(30,-30),表示从标注点x轴方向上增加30,y轴方向上减30的位置
# xycoords 、textcoords :这两个参数试了好多次没弄明白,只知道 xycoords='data'给定就行,
# textcoords='offset points' 标注的内容从xy设置的点进行偏移xytext
# textcoords='data' 标注内容为xytext的绝对坐标
# fontsize : 字体大小,这个没什么好说的
# arrowstyle : 箭头样式'->'指向标注点 '<-'指向标注内容 还有很多'-'
# '->' head_length=0.4,head_width=0.2
# '-[' widthB=1.0,lengthB=0.2,angleB=None
# '|-|' widthA=1.0,widthB=1.0
# '-|>' head_length=0.4,head_width=0.2
# '<-' head_length=0.4,head_width=0.2
# '<->' head_length=0.4,head_width=0.2
# '<|-' head_length=0.4,head_width=0.2
# '<|-|>' head_length=0.4,head_width=0.2
# 'fancy' head_length=0.4,head_width=0.4,tail_width=0.4
# 'simple' head_length=0.5,head_width=0.5,tail_width=0.2
# 'wedge' tail_width=0.3,shrink_factor=0.5
plt.annotate(s = r'$2x+1=%s$' % y0, xy=(x0, y0),xytext=(+30,-30), xycoords='data',textcoords='offset points', fontsize=16,arrowprops=dict(arrowstyle='<-', connectionstyle="arc3,rad=.2"))
# 直接在图片上添加文字做标注,实际是添加文字
# (-4,3)坐标处开始输入,输入的内容空格要用\转义,
plt.text(-4, 3, r'$This\ is\ the\ some\ text. \mu\ \sigma_i\ \alpha_t$',fontdict={'size': 16, 'color': 'r'})
plt.show()
3 效果图
各项参数已经在代码中进行解释说明,大家可自行尝试,如果有什么需要交流的,请留言,我会在有时间的时候及时回复的。

相关文章推荐
- matplotlib模块数据可视化-设置坐标轴
- matplotlib模块数据可视化-修改坐标轴位置
- matplotlib模块数据可视化-设置图例
- matplotlib模块数据可视化-多图布局,分格显示
- matplotlib模块数据可视化-动画
- 数据可视化——Matplotlib模块入门(一)
- matplotlib模块数据可视化-图片处理
- matplotlib模块数据可视化-等高线图
- matplotlib模块数据可视化-设置tick的能见度
- matplotlib模块数据可视化-3D图
- matplotlib模块数据可视化-绘制散列图
- Python科学计算数据可视化模块-Matplotlib
- matplotlib模块数据可视化-饼状图及补充图
- matplotlib模块数据可视化-绘制柱状图
- matplotlib模块数据可视化-多图
- matplotlib模块数据可视化-设置次坐标轴
- matplotlib模块数据可视化-figure图像
- 动态可视化 数据可视化之魅D3,Processing,pandas数据分析,科学计算包Numpy,可视化包Matplotlib,Matlab语言可视化的工作,Matlab没有指针和引用是个大问题
- python—matplotlib数据可视化实例注解系列-----之箱状图
- 7057-1.Python数据可视化:利用matplotlib中的subplot进行图中图展示