matplotlib模块数据可视化-设置图例
2017-08-15 11:23
239 查看
1 说明
由于这一节写好后发表,这边文章全部变成了乱码,作者直接崩溃了,这一节不想再写一遍了,重新简单的放下代码和一张效果图,剩下的自行尝试。
2 第一种设置图例的方法
3 第二种图例
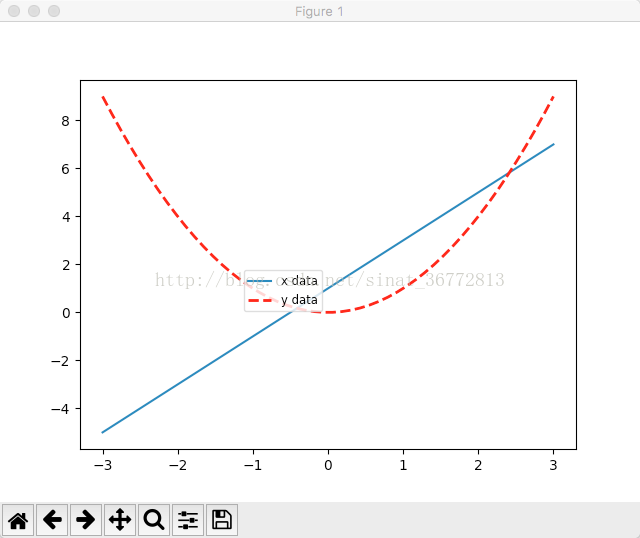
4 第三种图例
5 图例的参数
由于写过一次发布后乱码了,所以又简单的写了一下,各位可以自行尝试,如有疑问,可留言交流,谢谢理解。
由于这一节写好后发表,这边文章全部变成了乱码,作者直接崩溃了,这一节不想再写一遍了,重新简单的放下代码和一张效果图,剩下的自行尝试。
2 第一种设置图例的方法
x = np.linspace(-3,3,50)
y1 = 2*x + 1
y2 = x**2

# plt.figure()
import numpy as np
import matplotlib.pyplot as plt
#  Return value is a list of lines that were added. 将会返回一个line的list
plt.plot(x,y1,label='$2x+1$')
plt.plot(x,y2,color='red',linewidth=2,linestyle='--',label='$x^2$')
plt.legend()
plt.show()
3 第二种图例
import numpy as np
import matplotlib.pyplot as plt
x = np.linspace(-3,3,50)
y1 = 2*x + 1
y2 = x**2
# 2> 直接传入一个元祖,自动分配标示
plt.plot(x,y1)
plt.plot(x,y2,color='red',linewidth=2,linestyle='--')
plt.legend(('$2x+1$','$x^2$'))
plt.show()
4 第三种图例
import numpy as np
import matplotlib.pyplot as plt
x = np.linspace(-3,3,50)
y1 = 2*x + 1
y2 = x**2
# 根据绘图时返回回来的line对应指定,传入元祖或list都行
# ------------------------------------------------
# l1和l2是list,此时里面也各有一条线,所有用[0]索引取出
# plt.legend((l1[0],l2[0]),('x data','y data'),loc=1)
# ------------------------------------------------
#  Return value is a list of lines that were added. 将会返回一个line的list,所以接收返回值的时候可以默认解出来首个元素
# 在后面加上逗号l1,   l2,
l1, = plt.plot(x,y1)
l2, = plt.plot(x,y2,color='red',linewidth=2,linestyle='--')
plt.legend([l1, l2], ['$2x+1$','$x^2$'], loc='center', fontsize='small')
plt.show()
5 图例的参数
import numpy as np
import matplotlib.pyplot as plt
x = np.linspace(-3,3,50)
y1 = 2*x + 1
y2 = x**2
# 1> loc参数,可以对应字符串,也可以是code值,可选的有 loc='best' 与 loc=0相同
#   Location String   Location Code
#   ===============   =============
#   'best'            0     最优,覆盖有效图形最少的地方
#   'upper right'     1     右上角
#   'upper left'      2     左上角
#   'lower left'      3     左下角
#   'lower right'     4     右下角
#   'right'           5     右边  与7相同
#   'center left'     6     左边中部
#   'center right'    7     右边中部
#   'lower center'    8     下面中部
#   'upper center'    9     顶部中部
#   'center'          10    正中
#   ===============   =============

# 2> *fontsize*:  'xx-small' | 'x-small' | 'small' | 'medium' | 'large' | 'x-large' | 'xx-large'
# 标注的字体大小

# 3> bbox_to_anchor设置锚点的位置(0.5,1),标示横轴中间,竖轴顶部作为标识的右上角
# loc = 'lower left', bbox_to_anchor = (0.5, 0.5)  把标识图的左下角对应到整个图片的中点处
# loc = 'upper right', bbox_to_anchor = (0.5, 0.5)  把标识图的右上角对应到整个图片的中点处

plt.legend([l1,l2],['x data','y data'],fontsize='small' ,loc = 'upper right', bbox_to_anchor = (0.5, 0.5))
plt.show()
由于写过一次发布后乱码了,所以又简单的写了一下,各位可以自行尝试,如有疑问,可留言交流,谢谢理解。

相关文章推荐
- matplotlib模块数据可视化-设置坐标轴
- matplotlib模块数据可视化-设置tick的能见度
- matplotlib模块数据可视化-设置次坐标轴
- matplotlib模块数据可视化-Annotation标注
- 数据可视化——Matplotlib模块入门(一)
- matplotlib模块数据可视化-多图布局,分格显示
- Python科学计算数据可视化模块-Matplotlib
- matplotlib模块数据可视化-绘制散列图
- matplotlib模块数据可视化-图片处理
- python—matplotlib数据可视化实例注解系列-----设置标注字体样式(matplotlib颜色库)
- matplotlib模块数据可视化-多图
- Python数据可视化Matplotlib——Figure画布背景设置
- matplotlib模块数据可视化-动画
- matplotlib模块数据可视化-修改坐标轴位置
- matplotlib模块数据可视化-绘制柱状图
- python—matplotlib数据可视化实例注解系列-----之plot图线型设置
- matplotlib模块数据可视化-饼状图及补充图
- matplotlib模块数据可视化-等高线图
- matplotlib模块数据可视化-3D图
- matplotlib模块数据可视化-figure图像