R语言用于数据分析的基本统计函数与基础可视化
2017-05-23 20:25
531 查看
1.函数的基本用法
#将数据导入R中
> data(iris)
#平均数
> mean(iris$Sepal.Length)
[1] 5.843333
#标准差
> sd(iris$Sepal.Length)
[1] 0.8280661
#方差
> var(iris$Sepal.Length)
[1] 0.6856935
#最小值
> min(iris$Sepal.Length)
[1] 4.3
#最大值
> max(iris$Sepal.Length)
[1] 7.9
#中位数
> median(iris$Sepal.Length)
[1] 5.8
#值的范围
> range(iris$Sepal.Length)
[1] 4.3 7.9
#分位点
> quantile(iris$Sepal.Length)
0%  25%  50%  75% 100%
4.3  5.1  5.8  6.4  7.9
sapply()函数
#忽略缺失值(na.rm=TRUE),求iris数据框前4个属性的平均值
> sapply(iris[1:4],mean,na.rm=TRUE)
Sepal.Length  Sepal.Width Petal.Length  Petal.Width
5.843333     3.057333     3.758000     1.199333
#此处也可以用summary(iris)
> summary(iris)
Sepal.Length    Sepal.Width     Petal.Length    Petal.Width          Species
Min.   :4.300   Min.   :2.000   Min.   :1.000   Min.   :0.100   setosa    :50
1st Qu.:5.100   1st Qu.:2.800   1st Qu.:1.600   1st Qu.:0.300   versicolor:50
Median :5.800   Median :3.000   Median :4.350   Median :1.300   virginica :50
Mean   :5.843   Mean   :3.057   Mean   :3.758   Mean   :1.199
3rd Qu.:6.400   3rd Qu.:3.300   3rd Qu.:5.100   3rd Qu.:1.800
Max.   :7.900   Max.   :4.400   Max.   :6.900   Max.   :2.500
变量间的关联进行分析
Sepal.Length Sepal.Width Petal.Length Petal.Width
Sepal.Length    1.0000000  -0.1175698    0.8717538   0.8179411
Sepal.Width    -0.1175698   1.0000000   -0.4284401  -0.3661259
Petal.Length    0.8717538  -0.4284401    1.0000000   0.9628654
Petal.Width     0.8179411  -0.3661259    0.9628654   1.0000000
每一个属性对的协方差系数cov(iris[,1:4])
> cov(iris[,1:4])
Sepal.Length Sepal.Width Petal.Length Petal.Width
Sepal.Length    0.6856935  -0.0424340    1.2743154   0.5162707
Sepal.Width    -0.0424340   0.1899794   -0.3296564  -0.1216394
Petal.Length    1.2743154  -0.3296564    3.1162779   1.2956094
Petal.Width     0.5162707  -0.1216394    1.2956094   0.5810063
统计检验可用来评估结果的显著性,下例用t检验来分析样本之间的差异,具体任务是用t检验判断setosa与versicolor两类鸢尾花的花萼宽度的差别。如果p<0.5,说明这两类花的花萼宽度差别非常明显:
> t.test(iris$Petal.Width[iris$Species=="setosa"],
+ iris$Petal.Width[iris$Species=="versicolor"])

Welch Two Sample t-test

data:  iris$Petal.Width[iris$Species == "setosa"] and iris$Petal.Width[iris$Species == "versicolor"]
t = -34.08, df = 74.755, p-value < 2.2e-16
alternative hypothesis: true difference in means is not equal to 0
95 percent confidence interval:
-1.143133 -1.016867
sample estimates:
mean of x mean of y
0.246     1.326
同样也可以对鸢尾花的花萼宽度与花萼长度进行进行关联性检验,评分越接近1,正向相关越强,反之亦然。
> cor.test(iris$Sepal.Length[iris$Species=="setosa"],
+        + iris$Sepal.Width[iris$Species=="setosa"])

Pearson's product-moment correlation

data:  iris$Sepal.Length[iris$Species == "setosa"] and +iris$Sepal.Width[iris$Species == "setosa"]
t = 7.6807, df = 48, p-value = 6.71e-10
alternative hypothesis: true correlation is not equal to 0
95 percent confidence interval:
0.5851391 0.8460314
sample estimates:
cor
0.7425467
基础可视化
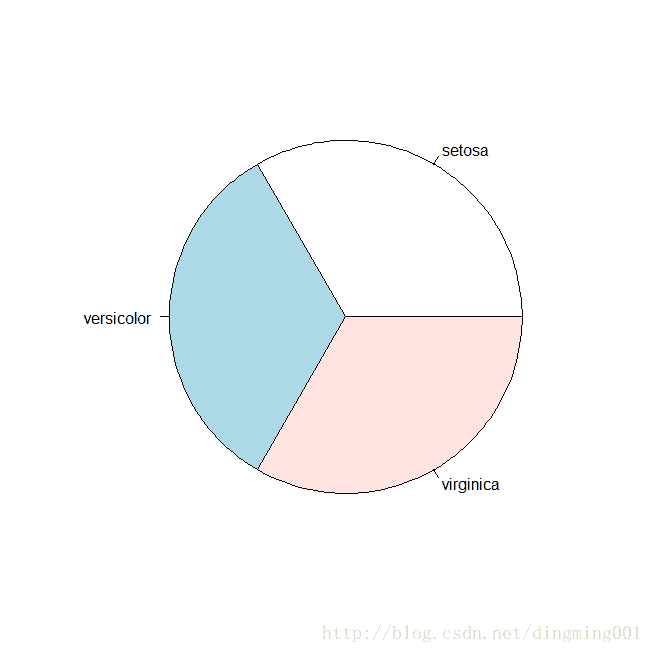
> data(iris)
> table.iris = table(iris$Species)
> table.iris

setosa versicolor  virginica
50         50      50
> pie(table.iris)
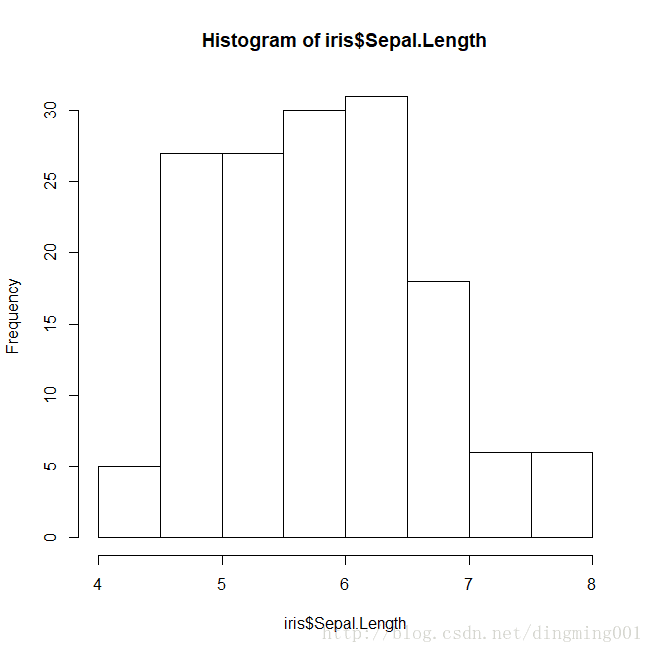
花萼分布的直方图
> hist(iris$Sepal.Length)
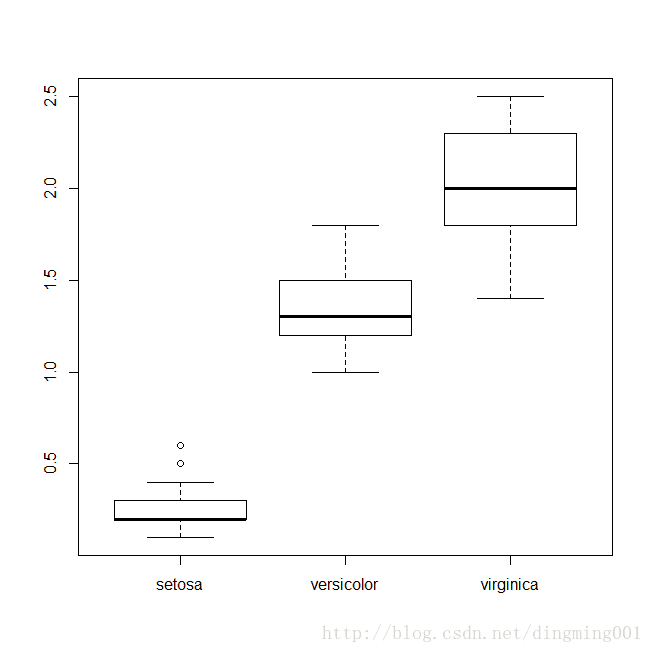
盒图,也称箱图
boxplot(Petal.Width ~ Species,data = iris)
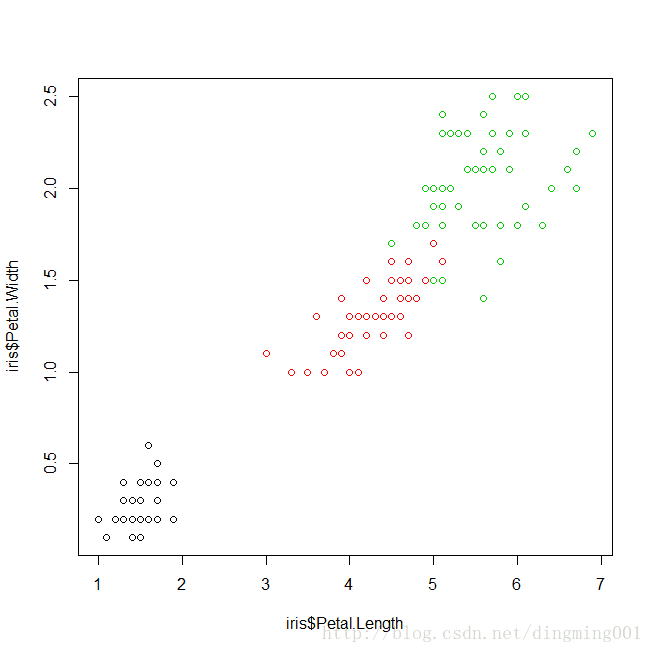
散点图,用在同一个图中比较两个变量关系的图
plot(x=iris$Petal.Length,y=iris$Ptal.Width,col=iris$Species)
绘制所有有两两之间的关系图
> pairs(iris[1:4],main = "IRIS DATE",pch=21,bg=c("red","green","blue")[unclass(iris$Species)])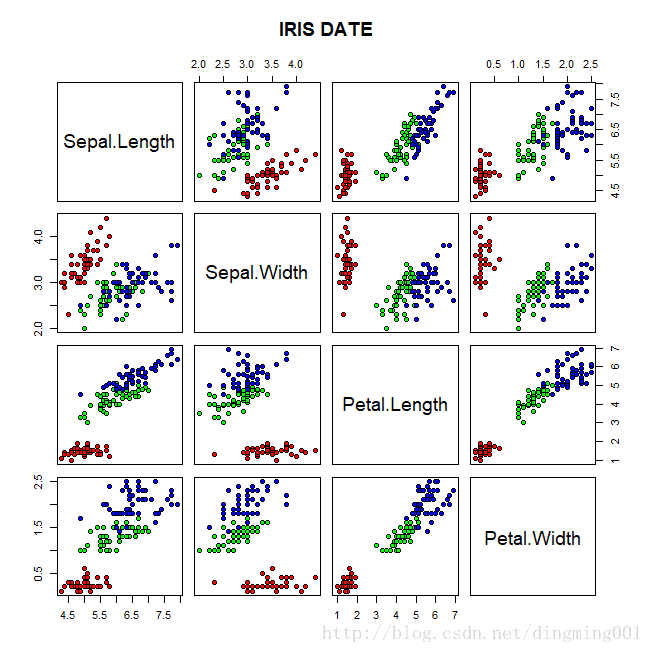
福利:一个可以下到免费数据的网站:http://archive.ics.uci.edu/ml/.

相关文章推荐
- R语言 基本数据分析
- 零基础数据分析与挖掘R语言实战课程(R语言)
- R语言 - 基于'狗熊会'基础数据:[筝声琴韵,寻寻觅觅]的案例分析 - 未完成
- R语言数据统计分析的基本函数
- java基础之IO流--DataOutputStream(专门用于操作Java基本数据类型的IO流对象)
- 数据分析基础——基本运算
- java核心基础--jdk源码分析学习--基本数据类型
- Python数据分析及可视化的基本环境
- 4个用于数据分析和可视化的 JavaScript 库
- Python 数据分析(一) 本实验将学习 pandas 基础,数据加载、存储与文件格式,数据规整化,绘图和可视化的知识
- R语言 基本数据分析
- 零基础数据分析与挖掘R语言实战课程(R语言)
- R语言案例分析:多元数据的基本统计分析
- R语言之数据可视化 - R的绘图系统2 - 基本绘图系统
- [置顶] 【R语言 数据处理和可视化】一个手游公司销售额数据分析
- 利用Python进行数据分析(8) pandas基础: Series和DataFrame的基本操作
- R语言生存分析数据分析可视化案例
- 慕课R语言之数据可视化学习笔记——3.3基本绘图系统实战
- Python 数据分析(一) 本实验将学习 pandas 基础,数据加载、存储与文件格式,数据规整化,绘图和可视化的知识
- R语言 基本数据分析