matplot 简单使用
2014-04-07 16:33
274 查看
设置 X,Y 轴变量
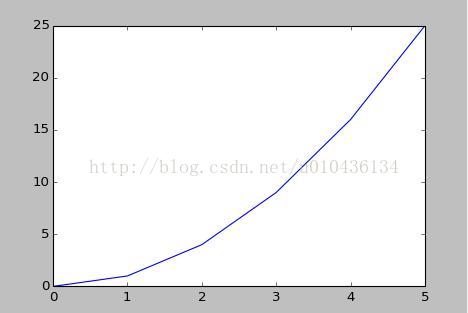
使用 numpy 设置变量,使用图像更平滑
一个图像中,同时显示多个图像
设置 X Y 轴的显示范围
设置标题

设置 legend (大概是图例的意思)
默认的显示位置:
设置成:plt.legend(loc='upper left'):
设置成 plt.legend(loc=(0.0,0.0)):
保存图片:
、
设置线的类型:

设置点的类型:
同时设置三种属性:
直接使用名称来设置:
使用其他标签来显示刻度:
以上均参考《Matplotlib.for.Python.Developers》一书
import matplotlib.pyplot as plt
# 生成 0 1 2 3 4 5
x = range(6)
# y = x 的平方
plt.plot(x,[xi**2 for xi in x])
plt.show()
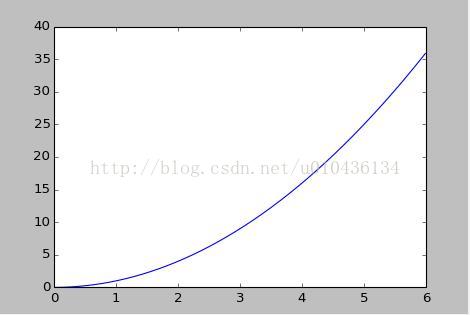
使用 numpy 设置变量,使用图像更平滑
import matplotlib.pyplot as plt
import numpy as np
# 使用变量增量为 0.01
x = np.arange(0.0,6.0,0.01)
plt.plot(x,[xi**2 for xi in x])
plt.show()
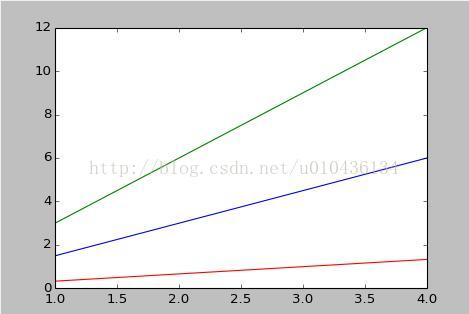
一个图像中,同时显示多个图像
import matplotlib.pyplot as plt
x = range(1,5)
# 直接使用一个语句 plt.plot(x,[xi*1.5 for xi in x],x,[xi*3.0 for xi in x],x,[xi/3.0 for xi in x])
plt.plot(x,[xi*1.5 for xi in x])
plt.plot(x,[xi*3.0 for xi in x])
plt.plot(x,[xi/3.0 for xi in x])
# 图像是否一直保持,默认是 True
plt.hold(True)
#图像一闪而过,默认是 False
plt.interactive(False)
plt.show()
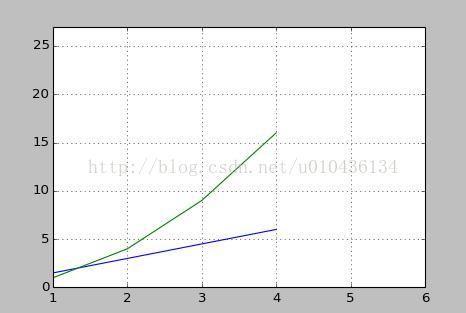
设置 X Y 轴的显示范围
import matplotlib.pyplot as plt
import numpy as np
x = np.arange(1,5)
plt.plot(x,x*1.5,x,x**2)
plt.grid(True) # 设置背景,这里是栅格
print plt.axis() # 结果是 (1.0, 4.0, 0.0, 16.0),不传参数,表示返回
plt.axis() # [xmin,xmax, ymin, ymax] 可以直接指定参数,如 plt.axis(xmin=10)
plt.axis([1.0,5.0,0.0,27.0])  # 设置X\Y轴显示的范围
print plt.xlim() #
print plt.ylim() # 可以 X Y 各自指定
plt.xlim([1.0,6.0]) #指X轴的
plt.show()
设置标题
import matplotlib.pyplot as plt
plt.plot([1,3,2,4])
plt.xlabel('This is the X axis')
plt.ylabel('This is the Y axis')
plt.title('Setting title')
plt.show()
设置 legend (大概是图例的意思)
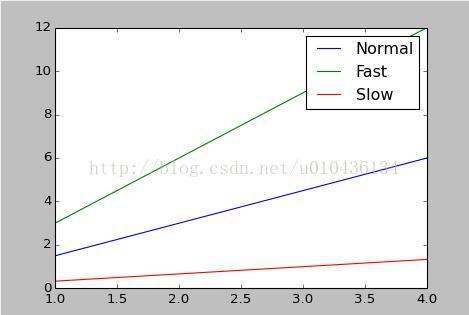
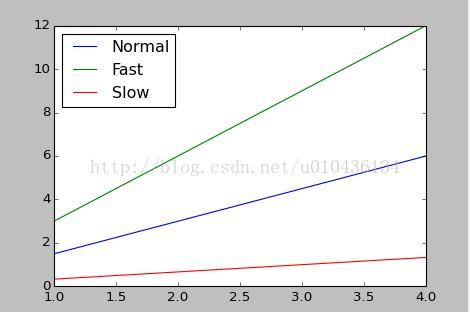
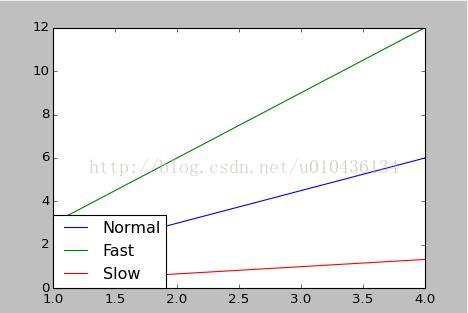
import matplotlib.pyplot as plt
import numpy as np
x = np.arange(1,5)
plt.plot(x,x*1.5,label='Normal')
plt.plot(x,x*3.0,label='Fast')
plt.plot(x,x/3.0,label='Slow')
# loc 可以设置的字符串
# best\upper right\upper left\lower left\lower right\right\center left\center right\lower center\upper center\center
plt.legend(loc='upper left')  #  默认是右上方显示
# 使用数字设置
#plt.legend(loc=(0.0,0.0))
plt.show()
默认的显示位置:
设置成:plt.legend(loc='upper left'):
设置成 plt.legend(loc=(0.0,0.0)):
保存图片:
import matplotlib.pyplot as plt
import matplotlib as mpl
print mpl.rcParams['figure.figsize'] #  [8.0, 6.0]
print mpl.rcParams['savefig.dpi'] # 100  图像质量是 800x600
plt.plot([1,3,2,4])
# 把图片保存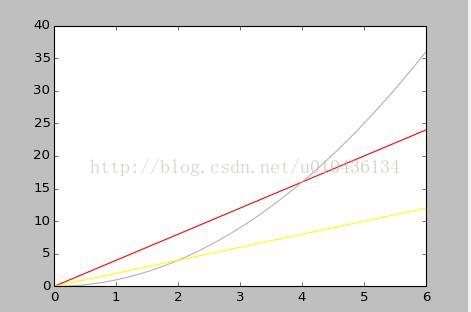
#plt.savefig('plot123.png',dip=200)设置线的颜色:import matplotlib.pyplot as plt import numpy as np x = np.arange(0.0,6.0,0.01) # y 是缩写形式,0.7 是灰度显示,#FFFF00 网页中的十六进制表示 # b=blue c=cyan g=green k=black m=magenta r=red w=white y=yellow plt.plot(x,x*4,'r') plt.plot(x,x**2,'0.7') plt.plot(x,x*2,'#FFFF00') plt.show()
、
设置线的类型:
import matplotlib.pyplot as plt
import numpy as np
x = np.arange(0.0,6.0,0.01)
#可以看到最后一个应该上默认
# - solid line  ---> solid
# -- dashed line ---> dashed
# -. dash-dot line ---> dashdot
# : dotted line ---> dotted
plt.plot(x,x*2,'--',x,x*4,'-.',x,x**2,':',x,x*6,'-')
plt.show()
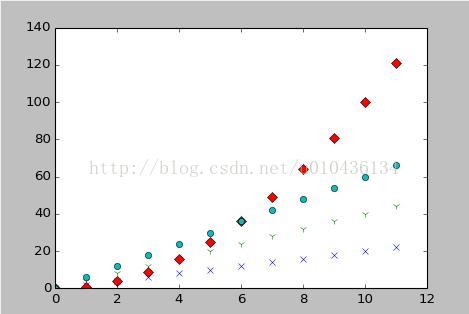
设置点的类型:
import matplotlib.pyplot as plt
import numpy as np
x = np.arange(0.0,12.0,1)
# 可选参数
# .,o
# . Point marker
# , Pixel marker
# o Circle marker
# v Triangle down marker
# ^ Triangle up marker
# < Triangle left marker
# > Triangle right marker
# 1 Tripod down marker
# 2 Tripod up marker
# 3 Tripod left marker
# 4 Tripod right marker
# s Square marker
# p Pentagon marker
# * Star marker
# h Hexagon marker
# H Rotated hexagon marker
# + Plus marker
# x Cross (x) marker
# D Diamond marker
# d Thin diamond
# marker
# | Vertical line (vline
# symbol) marker
# _ Horizontal line (hline symbol) marker
plt.plot(x,x*2,'x',x,x*4,'v',x,x**2,'D',x,x*6,'o')
plt.show()
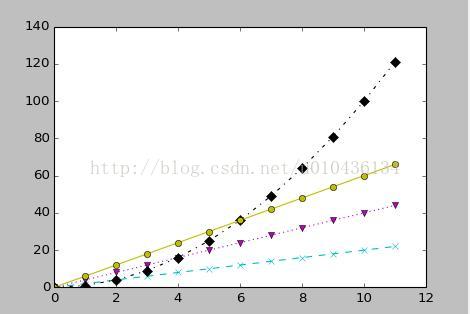
同时设置三种属性:
import matplotlib.pyplot as plt
import numpy as np
x = np.arange(0.0,12.0,1)
#颜色、线型、点型一起(颜色、点、线)
plt.plot(x,x*2,'cx--',x,x*4,'mv:',x,x**2,'kD-.',x,x*6,'yo-')
plt.show()
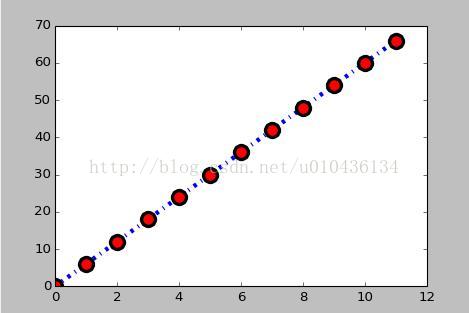
直接使用名称来设置:
import matplotlib.pyplot as plt
import numpy as np
x = np.arange(0.0,12.0,1)
# 使用键值对来设置
# color or c
#           Sets the color of the line; accepts any Matplotlib color format.
# linestyle
#           Sets the line style; accepts the line styles seen previously.
# linewidth
#           Sets the line width; accepts a float value in points.
# marker
#           Sets the line marker style.
# markeredgecolor
#           Sets the marker edge color; accepts any Matplotlib color format.
# markeredgewidth
#           Sets the marker edge width; accepts float value in points.
# markerfacecolor
#           Sets the marker face color; accepts any Matplotlib color format.
# markersize
#           Sets the marker size in points; accepts float values.

plt.plot(x,x*6,c='blue',linestyle='dashdot',linewidth='4',marker='o',markerfacecolor='red',markeredgecolor='black',markeredgewidth=3,markersize=12)
plt.show()
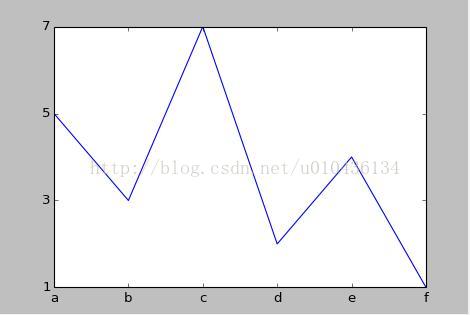
使用其他标签来显示刻度:
import matplotlib.pyplot as plt
x = [5,3,7,2,4,1]
plt.plot(x);
#每一个增量位置,使用什么指明
plt.xticks(range(len(x)),['a','b','c','d','e','f'])
#指定了增长的步长 2
plt.yticks(range(1,8,2))
plt.show()
以上均参考《Matplotlib.for.Python.Developers》一书

相关文章推荐
- Python-Matplotlib安装及简单使用
- Matplotlib的简单使用
- Python-Matplotlib安装及简单使用
- 使用matplotlib画图的简单封装
- matplotlib使用scatter画简单的散点图
- 使用python matplotlib绘制简单图形
- Python-Matplotlib安装及简单使用
- 使用matplotlib绘制简单的折线图
- Python使用matplotlib简单绘图示例
- Python-Matplotlib安装及简单使用
- Python-Matplotlib安装及简单使用
- Python-Matplotlib安装及简单使用
- Matplotlib简介和pyplot的简单使用——Artists
- matplotlib使用scatter画简单的散点图
- matplotlib简单使用
- 最简单的matplotlib安装和使用
- Python-Matplotlib安装及简单使用
- 最简单的matplotlib安装和使用
- Matplotlib简介和pyplot的简单使用
- 浅谈Matplotlib简介和pyplot的简单使用――文本标注和箭头