结合MATLAB、Python、R语言,在求得显著差异的边(节点对)之后,怎么画circle图
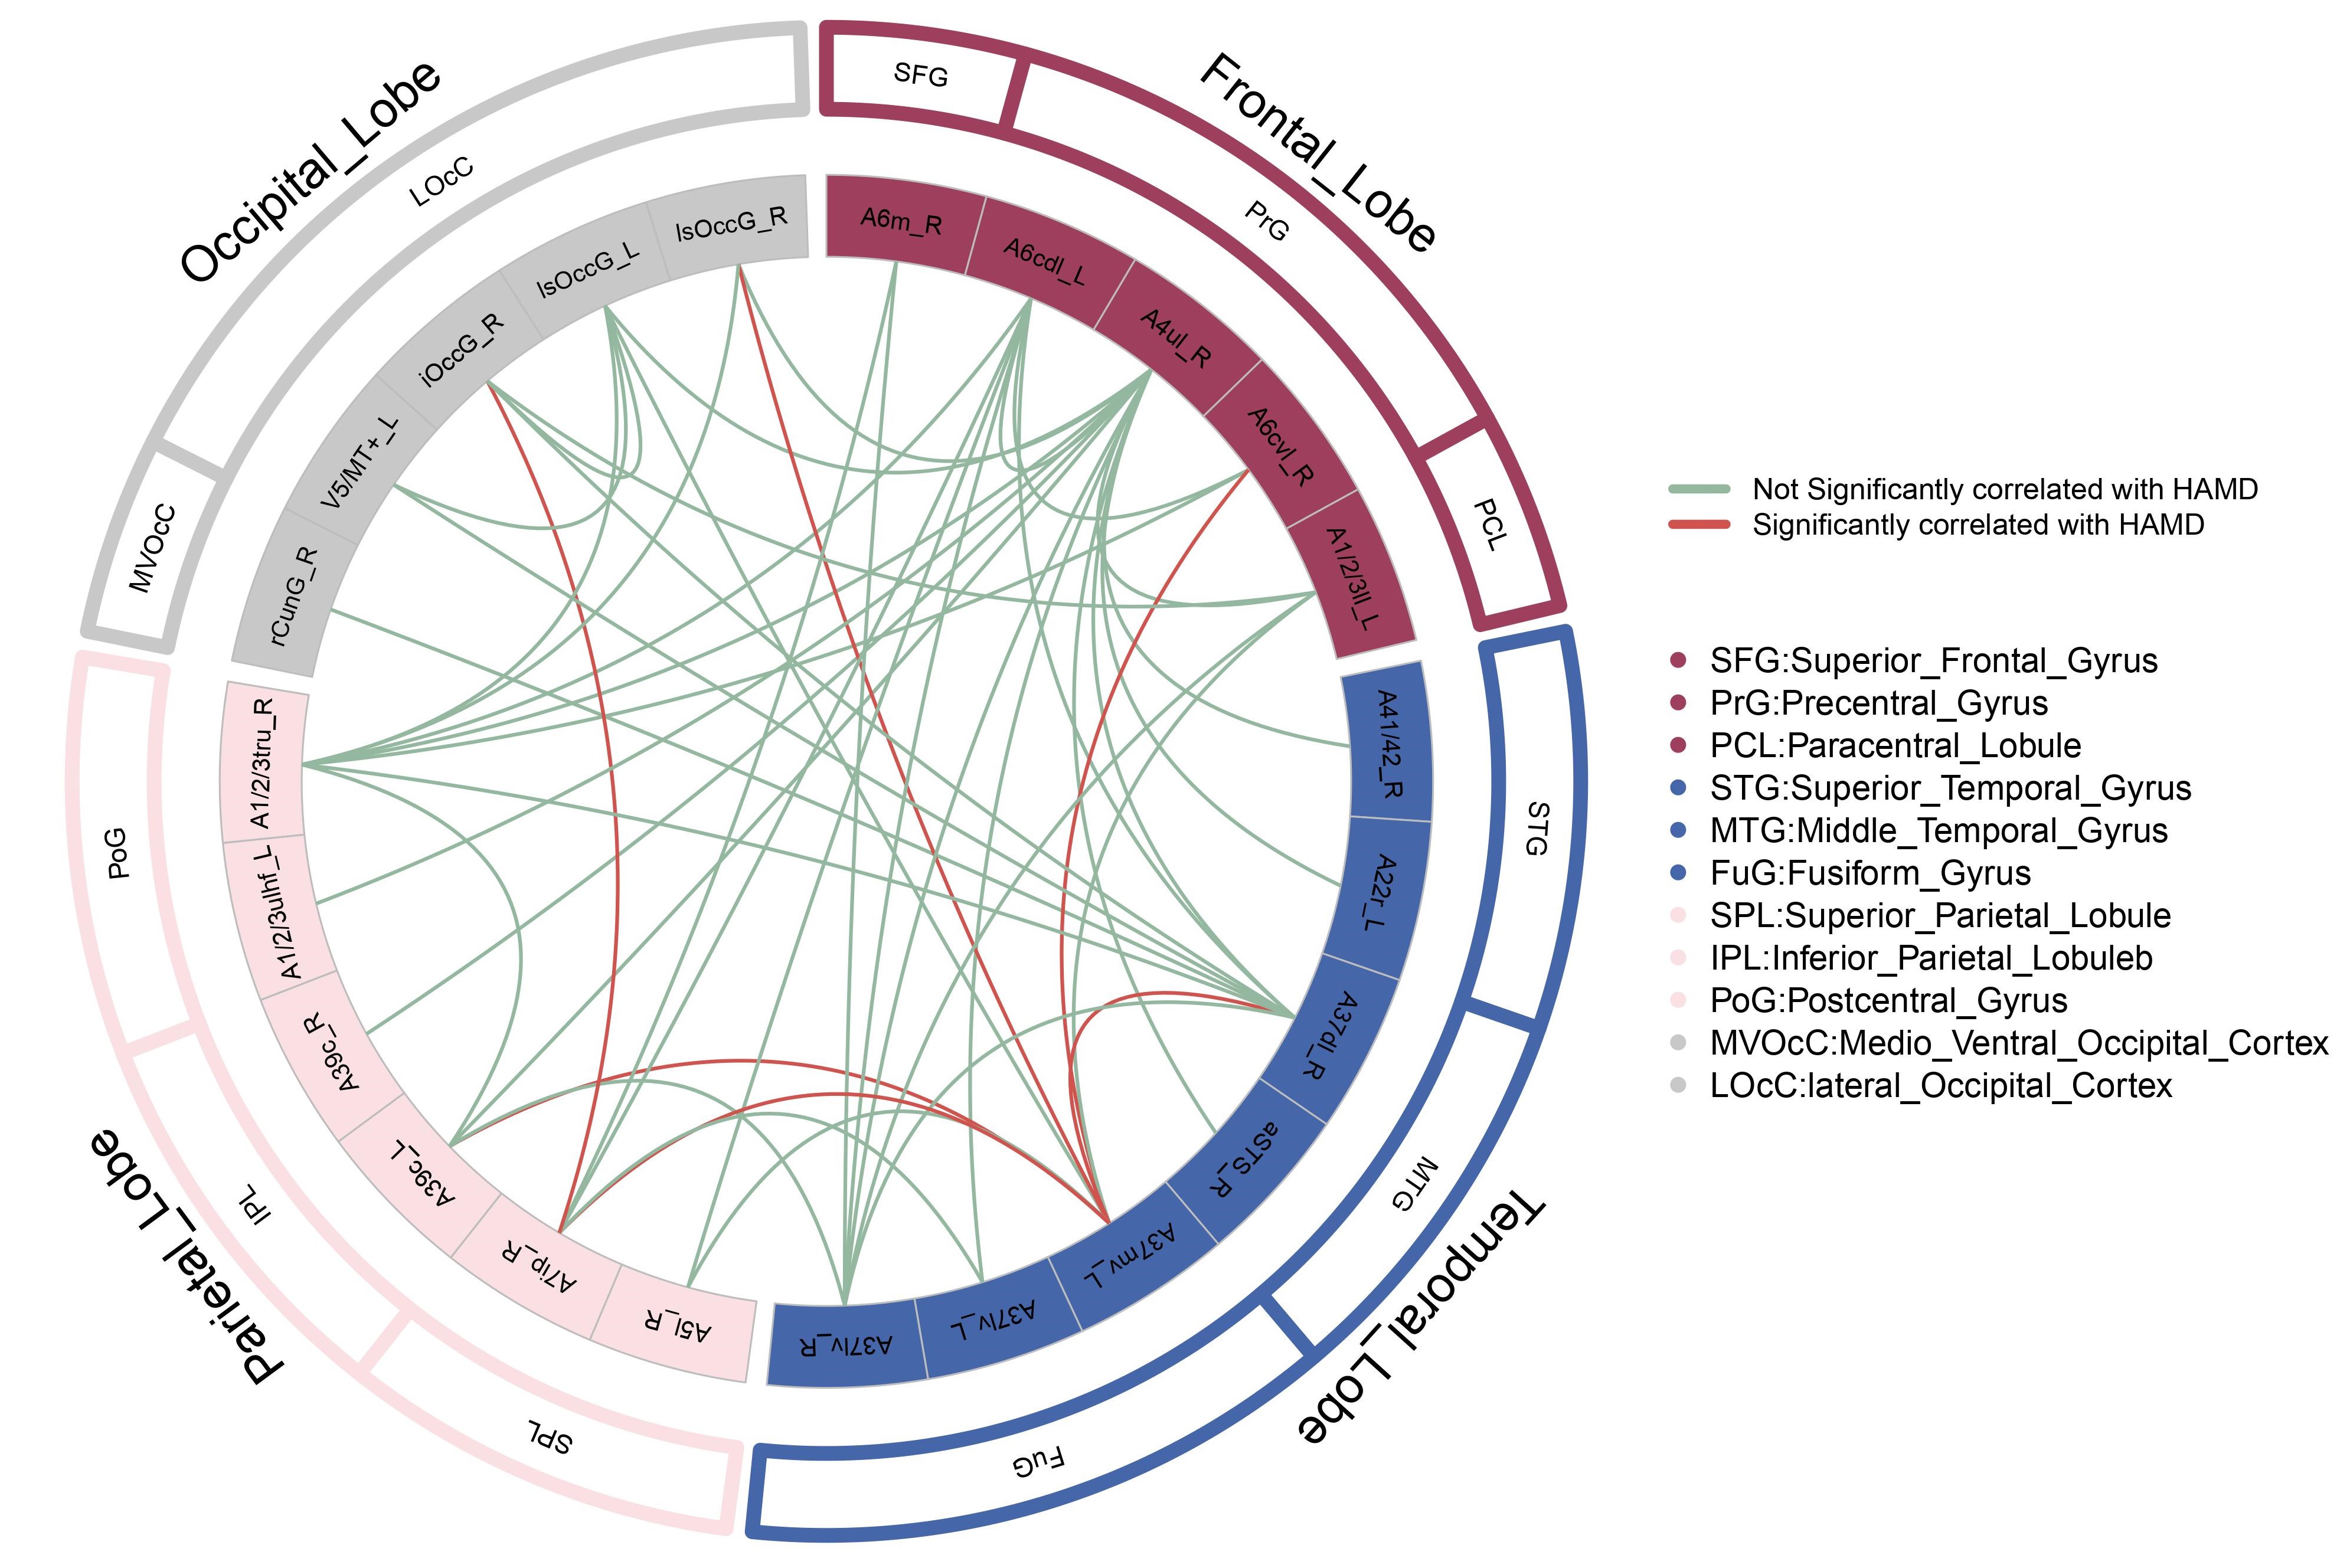
先来看看成果图:
OK,开始画图:
实验背景声明:在脑影像分析中,我们首先构建脑网络,然后使用双样本t对比两组人的连接差异,然后使用以上的图进行可视化,一般红色连接代表显著升高,绿色代表显著下降。(非必须,根据实际需求设计,如上图中红色代表相应的连接差异与HAMD抑郁量表评分显著相关,绿色表示不相关)。这里呢,我们研究了一组病人以及年龄性别匹配的健康被试的fMRI的数据,首先进行fMRI预处理,然后基于中科院246模板提取ROISignals,然后构建脑网络(细节不做介绍)。最后进行连接差异对比。然后得到病人组相对于正常被试组有哪些节点之间的连接权重出现了显著降低或显著升高。
Step1: R语言的画图代码MyCircle.R,这里我们先给出代码,根据代码的文件需求,准备材料。在以下代码中,开头即指明了需要的材料,有
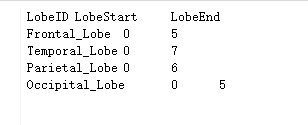
LobeID.txt;
GyrusID.txt;
ROIID.txt;
Links.txt
LobeID <- read.table("./Circle edges/LobeID.txt", header = TRUE, sep = "\t")
head(LobeID)
GeneID <- read.table("./Circle edges/GyrusID.txt", header = TRUE, sep = "\t")
head(GeneID)
GeneFe <- read.table("./Circle edges/ROIID.txt", header = TRUE, sep = "\t")
head(GeneFe)
Links <- read.table("./Circle edges/Links.txt", header = TRUE, sep = "\t")
head(Links)

LobeID$LobeID <- factor(LobeID$LobeID, levels = LobeID$LobeID)

library(stringi)
library(circlize)

pdf("circlize1.pdf",width = 17.5,height = 10)
par(mar=rep(0,4))
circos.clear()
circos.par(start.degree = 90, #从哪里开始画,沿着逆时针顺序
gap.degree = 2, #每两个sectors间的间隔大小,此处是每两个组间的间隔
track.margin = c(0,0.08), #gap.degree规定了左右,track.margin规定上下
cell.padding = c(0,0,0,0) #?
)

#### 根据"LobeID.txt"画组
#图是多个组围成的一个圈,其中每个组及其亚组都画在一个单独的坐标系里

circos.initialize(factors = LobeID$LobeID,
xlim = cbind(LobeID$LobeStart, LobeID$LobeEnd))

circos.trackPlotRegion(ylim = c(0, 1), factors = LobeID$LobeID, track.height=0.1,

#panel.fun for each sector
panel.fun = function(x, y) {
#select details of current sector
name <- get.cell.meta.data("sector.index")
i <- get.cell.meta.data("sector.numeric.index")
xlim <- get.cell.meta.data("xlim")
ylim <- get.cell.meta.data("ylim")

#组ID文字的设置
circos.text(x = mean(xlim),
y = 1,
labels = name,
cex = 1.7,   #组ID文字大小
#col = "darkgrey", #组ID的颜色
adj = c(0.5,-0.8)
#如果想让组ID呈放射状排列,就用下面三行代替上面那行
#niceFacing = TRUE, #组ID头朝上
#facing = "reverse.clockwise",
#adj = c(1.5, -0.8) #组ID的位置
)

#画组
circos.rect(xleft = xlim[1],
ybottom = ylim[1],
xright = xlim[2],
ytop = ylim[2],
col = "blue",
border = "black")
})

#### 根据"GyrusID.txt"画亚组

library(graphics)
#bgcol <- rainbow(sum(LobeID$LobeEnd), s = 1, v = 1, start = 0, end = max(1, sum(LobeID$LobeEnd) - 1)/sum(LobeID$LobeEnd), alpha = 1)

for (i in seq_len(nrow(GeneID))){
ylim <- c(0, 1)
circos.rect(sector.in
56c
dex = GeneID$LobeID[i],
track.index = 1,
xleft = GeneID$featureStart[i], # + 0.01, #让feature之间流出空隙
ybottom = ylim[1],
xright = GeneID$featureEnd[i], # - 0.01, #让feature之间流出空隙
ytop = ylim[2],
#如果想让每个方块颜色不同,用彩虹色画每一个Gene feature就运行下面这行
#col = bgcol[i],
#如果想让每个组用同一个颜色,调用输入文件中写好的颜色,就运行下面这行
col = "white",
border = paste("#", GeneID$barColor[i], sep = ""), lwd = 8)
}

# 亚组的文字
for (i in seq_len(nrow(GeneID))){
ylim <- c(0, 1)
circos.text((GeneID$featureStart[i] + GeneID$featureEnd[i])/2,
ylim[1] + 0.5,
GeneID$GyrusID[i],
sector.index = GeneID$LobeID[i],
facing = "inside",
cex = 0.9)
}

circos.trackPlotRegion(ylim = c(0, 1), factors = LobeID$LobeID, track.height=0.1,

#panel.fun for each sector
panel.fun = function(x, y) {
#select details of current sector
name <- get.cell.meta.data("sector.index")
i <- get.cell.meta.data("sector.numeric.index")
xlim
103c
<- get.cell.meta.data("xlim")
ylim <- get.cell.meta.data("ylim")

#画组
circos.rect(xleft = xlim[1],
ybottom = ylim[1],
xright = xlim[2],
ytop = ylim[2],
col = "blue",
border = "white",lwd = 6)
})

#提需求的小伙伴还想让圆圈图中每个方块颜色不同,整体显示彩虹色,就像circlize_rainbow.pdf那样的效果,就把下面这个for循环里的“col = ...”行换成“col = bgcol[i], ”
#运行下面两行,设置彩虹色
library(graphics)
bgcol <- rainbow(sum(LobeID$LobeEnd), s = 1, v = 1, start = 0, end = max(1, sum(LobeID$LobeEnd) - 1)/sum(LobeID$LobeEnd), alpha = 1)

for (i in seq_len(nrow(GeneFe))){
ylim <- c(0, 1)
circos.rect(sector.index = GeneFe$LobeID[i],
track.index = 2,
xleft = GeneFe$featureStart[i], # + 0.01, #让feature之间流出空隙
ybottom = ylim[1],
xright = GeneFe$featureEnd[i], # - 0.01, #让feature之间流出空隙
ytop = ylim[2],
#如果想让每个方块颜色不同,用彩虹色画每一个Gene feature就运行下面这行
#col = bgcol[i],
#如果想让每个组用同一个颜色,调用输入文件中写好的颜色,就运行下面这行
col = paste("#", GeneFe$barColor[i], sep = ""),
border = "gray")
}

# 亚组的文字
for (i in seq_len(nrow(GeneFe))){
ylim <- c(0, 1)
circos.text(GeneFe$featureStart[i] + 0.5,
ylim[1] + 0.5,
GeneFe$ROIID[i],
sector.index = GeneFe$LobeID[i],
facing = "inside",
cex = 0.8)
}

#### 根据"Links.txt"画连线

for(i in seq_len(nrow(Links))){
circos.link(sector.index1 = Links$ROI_1[i],
point1 = Links[i, 2],
sector.index2 = Links$ROI_2[i],
point2 = Links[i, 4],

#在输入文件中已经写好了连线的颜色
col = paste("#", Links$link_color[i], sep = ""),
#如果不想在输入文件中写颜色,还可以运行下面这行,在这里指定颜色
#col = "red",

border = FALSE,
lwd = 2, #连线的粗细
rou = 0.64, #连线起始和终止点的y值(圆半径的百分比)
h.ratio = 0.7 #连线的拱形高度,数值越大,拱形越低
#h.ratio = Links$link_height[i] #在输入文件中指定拱形高度
)
}

#Legend of brain regions

GeneCol<-data.frame(legendID=GeneID$GyrusID,legendCol=GeneID$barColor)
GeneCol_uniq<-base::unique(GeneCol)
legend(1,0.2,
bty = "n",#不要边框
pch = 16,#画成正方形,圆点是16
cex = 1.2,
legend = c("SFG:Superior_Frontal_Gyrus","PrG:Precentral_Gyrus","PCL:Paracentral_Lobule",
"STG:Superior_Temporal_Gyrus","MTG:Middle_Temporal_Gyrus","FuG:Fusiform_Gyrus",
"SPL:Superior_Parietal_Lobule","IPL:Inferior_Parietal_Lobuleb","PoG:Postcentral_Gyrus",
"MVOcC:Medio_Ventral_Occipital_Cortex","LOcC:lateral_Occipital_Cortex"),
col = paste0("#",GeneCol_uniq$legendCol),
horiz = FALSE)

#Legend of links
LinksCol<-data.frame(Links$link_color)
LinksCol_uniq<-base::unique(LinksCol)
legend(1,0.4,
bty = "n",
lty = 1,#画线
lwd = 5,#线的粗细
legend = c("Not Significantly correlated with HAMD","Significantly correlated with HAMD"),
col = paste0("#",LinksCol_uniq$Links.link_col),
horiz = FALSE)

dev.off()
Step2: 准备材料
以上提到的几 ad8 个文件,内容是这个样子的:
LobeID.txt;
GyrusID.txt;

ROIID.txt;

Links.txt

根据以上的内容就可以正常使用画图了,如果你不会写代码,就自己一点一点的敲文字就好了。
如果熟悉基本的文本处理,接下来用代码辅助制作材料就可以啦,这里我使用MATLAB+python辅助实现,都是很简单的脚本,
可以提高准确性,提高效率,给大家参考。一下代码不是最好的,跟随着作者的意识流生成的,可优化空间很大,但是一定能达到目标:
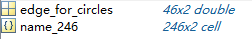
Base材料:
edge_for_circles: 代表节点对,及具有显著差异的边
name_246:代表中科院246模板的子节点名字(label)---->http://atlas.brainnetome.org/
衍生材料:
根据以上矩阵,使用以下matlab代码制作衍生材料,然后将edge_all_s存储为mat文件,命名为"edge_num.mat",如下图:
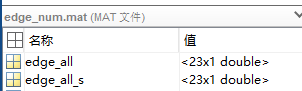
edge_all = unique(edge_for_cirles);  %得到独一无二的脑区代号
edge_all_s = sort(edge_all);     %对以上脑区编号排个序
edge_s = sortrows(edge_for_cirles);  %对节点对进
1044
行扩展排序,按照起点的排序进行排序
name_all = name_246(edge_all_s,2);   %得到节点名的mat矩阵
(1)LobeID.txt制作过程:
我们需要知道涉及的Lobe有哪些,而上面的代码可以知道所有的子区,根据子区的number,定位Lobe,这里使用了一个python的脚本把相应的名字读出来了,代码中出现的
full_nameOfROIs.csv文件,以及所有的代码文件皆可以在本人github网站下载:https://github.com/chaochaobar/circles_for_brain
import scipy.io as sio
import pandas as pd

datafile = './edge_num.mat'
mat = sio.loadmat(datafile)
full_name = pd.read_csv("./full_nameOfROIs.csv")
index_global = mat['edge_all_s']
save_file_name = "for_circle.node"

i = 0
for line in open('./node246.node'):
i = i + 1
a = i // 2
b = i % 2
if b == 0:
app = full_name["ROI_R"][a - 1]
elif b == 1:
app = full_name["ROI_L"][a]
if i in index_global:
if i in range(0, 69):
Lobe = "Frontal_Lobe"
if i in range(0, 15):
Gyrus = "Superior_Frontal_Gyrus"
elif i in range(1
25f4
5, 29):
Gyrus = "Middle_Frontal_Gyrus"
elif i in range(29, 41):
Gyrus = "Inferier_Frontal_Gyrus"
elif i in range(41, 53):
Gyrus = "Orbital_Gyrus"
elif i in range(53, 65):
Gyrus = "Precentral_Gyrus"
elif i in range(65, 69):
Gyrus = "Paracentral_Lobule"
elif i in range(69, 125):
Lobe = "Temporal_Lobe"
if i in range(69, 81):
Gyrus = "Superior_Temporal_Gyrus"
elif i in range(81, 89):
Gyrus = "Middle_Temporal_Gyrus"
elif i in range(89, 103):
Gyrus = "Inferior_Temporal_Gyrus"
elif i in range(103, 109):
Gyrus = "Fusiform_Gyrus"
elif i in range(109, 121):
Gyrus = "Parahippocampal_Gyrus"
elif i in range(121, 125):
Gyrus = "posterior_Superior_Temporal_Sulcus"
elif i in range(125, 163):
Lobe = "Parietal_Lobe"
if i in range(125, 135):
Gyrus = "Superior_Parietal_Lobule"
elif i in range(135, 147):
Gyrus = "Inferior_Parietal_Lobule"
elif i in range(147, 155):
Gyrus = "Precuneus"
elif i in range(155, 163):
Gyrus = "Postcentral_Gyrus"
elif i in range(163, 175):
Lobe = "Insular_Lobe"
Gyrus = "Insular_Gyrus"
elif i in range(175, 189):
Lobe = "Limbic_Lobe"
Gyrus = "Cingulate_Gyrus"
elif i in range(189, 211):
Lobe = "Occipital_Lobe"
if i in range(189, 199):
Gyrus = "Medio_Ventral_Occipital_Cortex"
elif i in range(199, 211):
Gyrus = "lateral_Occipital_Cortex"
elif i in range(211, 247):
Lobe = "Subcortical_Nuclei"
if i in range(211, 215):
Gyrus = "Amygdala"
elif i in range(215, 219):
Gyrus = "Hippocampus"
elif i in range(219, 231):
Gyrus = "Basal_Ganglia"

564
elif i in range(213, 247):
Gyrus = "Thalamus"
print(Lobe, ",", Gyrus, ",", line)
with open(save_file_name, "a+") as f:
f.write("{Lobe} {Gyrus} {line}".format(Lobe = Lobe, Gyrus = Gyrus, line = line))
f.close()
生成了“for_circle.node”文件之后,使用matlab读取,在 56c 制作数据材料ROIID.txtyiji Links.txt文件的时候,先用以下matlab代码将每一列的内容生成出来,然后粘贴到excel里面,最后粘贴到txt文件里面,有点绕是吧,这就是意识流,用最快的方法,即便有点蛮力,但是省去了过多的思考,半自动化:
%制作ROIID:先使用python读lobe和gyrus的名字,然后执行下面的语句
[lobe,gyrus,x,y,z,t,name_sub] = textread('for_circle.node','%s %s %d %d %d %f %s');

%%% 制作LobeID, GyrusID, ROIID, LinkID,使用excel
for i = 1:len_sig
index_start = find(edge_all==edge_s(i, 1));
index_end = find(edge_all==edge_s(i, 2));
edges_all_name(i,1:2) = [name_all(index_start), name_all(index_end)
ad8
];
end

%%% start lobe , end lobe
for i = 1:len_sig
cur_start = edges_all_name{i, 1};
index_start = find(strcmp(C,cur_start));
cur_end = edges_all_name{i,2};
index_end = find(strcmp(C, cur_end));
edges_all_name_2(i, 1) = A(index_start, 1);
edges_all_name_2(i, 2) = A(index_end, 1);
end

%%% start lobe , end lobe
for i = 1:len_sig
cur_start = edges_all_name{i, 1};
index_start = find(strcmp(C,cur_start));
cur_end = edges_all_name{i,2};
index_end = find(strcmp(C, cur_end));
edges_all_name_2(i, 1) = B(index_start, 1);
edges_all_name_2(i, 2) = B(index_end, 1);
end

%%% 制作LinkID的代码
point1 = zeros(len_sig, 1);
point2 = zeros(len_sig, 1);
for i = 1:len_sig
cur_start = edges_all_name{i, 1};
index_start = find(strcmp(C,cur_start));
cur_end = edges_all_name{i,2};
index_end = find(strcmp(C, cur_end));
point1(i, 1) = D(index_start, 1) + 0.5;
point2(i,1) = D(index_end, 1) + 0.5;
end
代码以及数据文件制作过程都有了,动手实践起来吧小伙伴们,有什么问题,欢迎联系:1374015299@qq.com

- ubuntu安装Python2和Python3之后怎么使用pip
- Python、Matlab和R语言我该如何选择?
- python在excel插入几个值之后,刷新表格公式的计算结果,怎么弄啊
- python波形图怎么像MATLAB一样叠在一起对比分析
- python 用excel获取数据之后怎么去读取某一列的全部数据
- python安装scikit-learn,Numpy,Matplotlib等包及之后怎么用
- foundations of python networking看了之后照上面的例子做。怎么都做不出来。以后成为高手再回来分析。
- python2和python3装好之后怎么安装pip
- tesserocr tesseract ....将tessdata放进Python安装目录之后也tessdata invalid之后怎么办????
- mac下已有pyhon2.7,装了python3 之后,怎么调用python3啊
- MATLAB,R语言、Python、Java,到底哪种语言学机器学习最靠谱?
- 我为什么选择Python而不是Matlab和R语言呢?
- 简述:我为什么选择Python而不是Matlab和R语言
- Centos7不小心删除了自带的python2之后怎么办?
- 【Python】Pandas进行去重操作之后怎么重新排index?
- 深度神经网络课程Python与Matlab实现的差异
- 安装完Anaconda之后输入python有warning警告该怎么解决
- 拿到一个模块之后怎么安排成员去做?
- python2与python3共存之后 pip 无法使用
- Hadoop集群中改变了其中一个节点的主机名之后 的ssh连接问题