elk-6.8.1安装-centos-7.6
【推荐】2019 Java 开发者跳槽指南.pdf(吐血整理) >>>

下载rpm包
官方地址
https://www.elastic.co/cn/downloads/past-releases#kibana
腾讯镜像地址(下载速度快)
https://mirrors.cloud.tencent.com/elasticstack/6.x/yum/6.8.1/
安装elasticsearch
wget https://mirrors.cloud.tencent.com/elasticstack/6.x/yum/6.8.1/elasticsearch-6.8.1.rpm
rpm -ivh elasticsearch-6.8.1.rpm
修改配置文件简单配置以下值
cat /etc/elasticsearch/elasticsearch.yml |grep -v ^#
path.data: /var/lib/elasticsearch
path.logs: /var/log/elasticsearch
network.host: 172.16.0.43
http.port: 9200
启动
systemctl start elasticsearch.service
此处会有报错,可能是编译安装的java需要手动指定变量值
/etc/profile写入变量也未生效
报错信息如下
journalctl -u elasticsearch.service
...
Jul 05 15:20:47 ol43 elasticsearch[20037]: which: no java in (/usr/local/sbin:/usr/local/bin:/usr/sbin:/usr/bin)
Jul 05 15:20:47 ol43 elasticsearch[20037]: warning: Falling back to java on path. This behavior is deprecated. Specify JAVA_H
Jul 05 15:20:47 ol43 elasticsearch[20037]: could not find java; set JAVA_HOME
...
手动指定变量值
head -n 2 /usr/share/elasticsearch/bin/elasticsearch-env
#!/bin/bash
JAVA_HOME=/usr/local/jdk1.8.0_202
启动
systemctl start elasticsearch.service
验证
curl 172.16.0.43:9200
{
"name" : "azFRc7L",
"cluster_name" : "elasticsearch",
"cluster_uuid" : "s8nLQgc_SWqSoRa5u7fqCg",
"version" : {
"number" : "6.8.1",
"build_flavor" : "default",
"build_type" : "rpm",
"build_hash" : "1fad4e1",
"build_date" : "2019-06-18T13:16:52.517138Z",
"build_snapshot" : false,
"lucene_version" : "7.7.0",
"minimum_wire_compatibility_version" : "5.6.0",
"minimum_index_compatibility_version" : "5.0.0"
},
"tagline" : "You Know, for Search"
}
启动成功
安装kibana
wget https://mirrors.cloud.tencent.com/elasticstack/6.x/yum/6.8.1/kibana-6.8.1-x86_64.rpm
rpm -ivh kibana-6.8.1-x86_64.rpm
修改配置文件
cat /etc/kibana/kibana.yml |grep -Ev '^#|^$'
server.port: 5601
server.host: "172.16.0.43"
elasticsearch.hosts: ["http://172.16.0.43:9200"]
启动
systemctl start kibana
验证
浏览器访问
172.16.0.43:5601
安装filebeat
wget https://mirrors.cloud.tencent.com/elasticstack/6.x/yum/6.8.1/filebeat-6.8.1-x86_64.rpm
rpm -ivh filebeat-6.8.1-x86_64.rpm
修改配置文件
cat /etc/filebeat/filebeat.yml |grep -Ev '^#|^$|#'
filebeat.inputs:
- type: log
enabled: false
paths:
- /var/log/*.log
- type: log
enabled: true
paths:
- /opt/jar/app-service/app-service.log
fields:
doc_type: app-service
filebeat.config.modules:
path: ${path.config}/modules.d/*.yml
reload.enabled: false
setup.template.settings:
index.number_of_shards: 3
setup.kibana:
output.elasticsearch:
hosts: ["172.16.0.43:9200"]
启动
systemctl start filebeat
验证
手动到kibana上查看索引
点击index patterns

点击 create index patterns 能看到对应记录即为成功

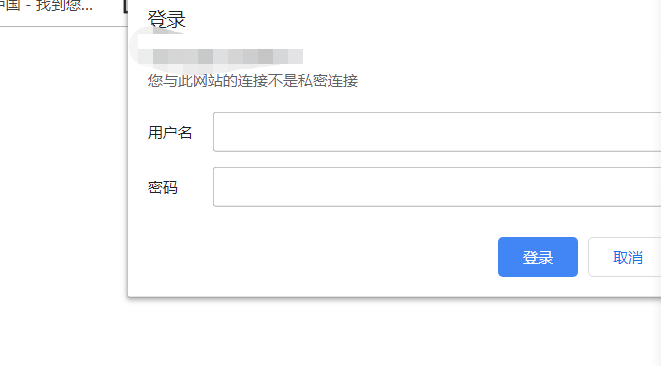
为kibana添加登陆验证
htpasswd -c /opt/app/nginx/conf/conf.d/.kibana-user admin
nginx配置
server {
listen 80;

server_name elk.888.com;

auth_basic "Restricted Access";
auth_basic_user_file /opt/app/nginx/conf/conf.d/.kibana-user;

location / {
proxy_pass http://172.16.0.43:5601;
proxy_http_version 1.1;
proxy_set_header Upgrade $http_upgrade;
proxy_set_header Connection 'upgrade';
proxy_set_header Host $host;
proxy_cache_bypass $http_upgrade;
}
}
登陆验证效果如下

- Centos7.6 安装 jdk1.8
- CentOS7.6(1810)安装
- 阿里云ecs Centos7.6 安装apache PHP72 Mysql8 构建wordpress5.03网站
- centos7下搭建lnmp环境包含yum源直接安装和源码编译安装,以及php5.3和php7.6版本
- Centos7 之安装Logstash ELK stack 日志管理系统
- CENTOS6.5安装日志分析ELK elasticsearch + logstash + redis + kibana
- CentOS7.6_1810安装最新版的java11.02和tomcat9.0.14的记录
- 在centos上安装elk
- centos7下安装docker(18.2docker日志---ELK)
- CentOS 7下ELK的安装和配置
- centos6.5安装ELK
- CentOS7.6利用源码包安装Apache
- java分布式商城项目环境搭建1-CentOS7.6-安装JDK1.8
- 菜鸟日志:CentOS7.6图形模式rpm安装oracle18.3
- CentOS 7.6安装使用Ansible(三):Ansible Playbook和变量类型
- Centos7.0 安装ELK(5.5.1版本)
- centos7.6安装rancher
- centos7.6 安装Tomcat-8.5.39的方法
- CentOS 7.6基于Xampp集成环境安装部署Lepus监控MySQL 5.7
- CentOS7.6中安装Apache及Apache常见操作和配置说明