CentOS7安装ELK日志分析系统
一、ELK简介
通俗来讲,ELK是由Elasticsearch、Logstash、Kibana三个开源软件组成的一个组合体,这三个软件当中,每个软件用于完成不同的功能。ELK又称为ELKstack,官方域名为stactic.co,ELKstack的主要优点有如下几个:
处理方式灵活:elasticsearch是实时全文索引,具有强大的搜索功能。
配置相对简单:elasticsearch全部使用JSON接口,logstash使用模块配置,kibana的配置文件部分更简单。
检索性能高效:基于优秀的设计,虽然每次查询都是实时,但是也可以达到百亿级数据的查询妙级响应。
集群线性扩展:elasticsearch和logstash都可以灵活线性扩展。 前端操作绚丽:kibana的前端设计比较绚丽,而且操作简单。
什么是elasticsearch
是一个高度可扩展的开源全文搜索和分析引擎,它可实现数据的实时全文搜索、分布式实现高可用、提供API接口,可以处理大规模日志数据,比如nginx、tomcat、系统日志等功能。
架构:安装两台es作为集群,收集日志采用logstash或者filebeat,用redis做消息队列,最后在kibana中展示。
什么是logstash
可以通过插件实现日志收集和转发,支持日志 过滤,支持普通log、自定义json格式的日志解析。
什么是kibana
主要是通过接口调用elasticsearch的数据,并进行前端数据可视化的展现。
二、整体架构说明
本次拟使用两台CentOS7服务器(192.168.0.21和192.168.0.22),安装版本为5.6.1,整体架构如下图

三、准备工作
1.https://www.elastic.co/downloads 下载5.6.1版本的filebeat、logstash、elasticsearch、kibana
2.参考我的另一篇redis安装文档在192.168.0.22上安装好redis
四、服务器初始化
关闭防火墙和selinux
systemctl stop firewalld
systemctl disable firewalld
systemctl stop NetworkManager
systemctl disable NetworkManager
setenforce 0
sed -i s/SELINUX=enforcing/SELINUX=disabled/g /etc/selinux/config
打开文件数设置大点
echo "* - nofile 265536">> /etc/security/limits.conf
五、安装elasticsearch集群
1)先安装java环境
安装好java之后,做软连接到/usr/bin/下
ln -s /usr/java/jdk1.8.0_91/bin/java /usr/bin/java,不然elasticsearch启动的时候会报错:
elasticsearch: which: no java in (/usr/local/sbin:/usr/local/bin:/usr/sbin:/usr/bin)
2)yum -y install elasticsearch-5.6.1.rpm
3)修改配置 文件
第一台
vim /etc/elasticsearch/elasticsearch.yml
cluster.name: es-cluster   #集群名称
node.name: es-1        #节点名称
path.data: /data/esdata    #es存储数据的目录
path.logs: /var/log/elasticsearch   #es日志目录
bootstrap.memory_lock: true     #不使用swap,内存足够大时可以开启
network.host: 192.168.0.21       #本机的监听地址
http.port: 9200                 #监听端口
discovery.zen.ping.unicast.hosts: ["192.168.0.21", "192.168.0.22"]   #避免产生广播风暴,在公网上必须开启
第二台与第一台只有node.name: es-2,network.host: 192.168.0.22这两处不同
mkdir –p /data/esdata
mkdir –p /var/log/elasticsearch
cd /data/
chown elasticsearch:elasticsearch esdata
如果服务器的内存比较大,可以适当的调整下es的jvm内存,配置文件为/etc/elasticsearch/jvm.options,建议最小和最大内存设施之成一样大,官方配置文档最大建议30G以内。
启动es:
/etc/init.d/elasticsearch start
发现elasticsearch启动不起来,日志报错如下

解决该报错的方法,参考地址为https://www.elastic.co/guide/en/elasticsearch/reference/5.6/setting-system-settings.html
解决方法如下
systemctl edit elasticsearch
在文件中写入下面两行
[Service]
LimitMEMLOCK=infinity
然后执行systemctl daemon-reload 使配置生效
然后再启动:/etc/init.d/elasticsearch start  能够正常启动
4)安装elasticsearch插件之head
插件是为了完成不同的功能,官方提供了一些插件,但大部分是收费的,另外也有一些开发爱好者提供的插件,可以实现对elasticsearch集群的状态监控与管理配置等功能,head插件就是其中之一。
安装5.x版本的head插件:
在elasticsearch5.x版本以后,不再支持直接安装head插件,而是需要通过启动一个服务方式,git地址:https://github.com/mobz/elasticsearch-head
yum –y install npm
#NPM的全称是Node Package Manage,是随同NodeJS一起安装的包管理和分发工具,他很方便让JavaScript开发者下载、安装、上传以及管理已经安装的包。
git clone git://github.com/mobz/elasticsearch-head.git
cd elasticsearch-head
npm install grunt -save
ll node_modules/grunt #确认生成文件
npm install #执行安装

npm run start & #后台启动服务
修改elasticsearch服务配置文件:
开启跨域访问支持,然后重启elasticsearch服务:
vim /etc/elasticsearch/elasticsearch.yml
在最下方添加下面两行
http.cors.enabled: true
http.cors.allow-origin: "*"
重启elasticsearch:/etc/init.d/elasticsearch restart
在浏览器中访问http://192.168.0.21:9100/
然后再input框中输入其中一个es的地址,点击“连接”即可看到集群信息

5)python脚本监控es集群
import smtplib
from email.mime.text import MIMEText
from email.utils import formataddr
import subprocess
body = ""
false = "false"
obj = subprocess.Popen(("curl -sXGET http://192.168.56.11:9200/_cluster/health?pretty=true"),shell=True,stdout=subprocess.PIPE)
data = obj.stdout.read()
data1 = eval(data)
status = data1.get("status")
if status == "green":
print("50")
else:
print("100")
六、安装filebeat
其实日志可以用软件进行收集,甚至可以直接通过syslog将日志打印到日志过滤或者日志存储的设备上。用软件进行日志收集,推荐的是使用logstash或者filebeat。
两者的比较: logstash集日志收集和日志处理于一身,但是正常运行的logstash需占用几百兆的内存
filebeat是一个ELK官方推出的轻量级日志收集工具,用go语言编写,相比logstash占用资源更少,正常运行只占用几十兆内存,用于在没有安装java的服务器上专门收集日志。缺点是不具备logstash的filter插件功能。
我们的想法是,在日志的收集阶段,不进行日志的处理,只负责收集日志,减轻客户端服务器的压力,日志处理统一放到中心端的logstash中处理,故采用上面介绍的架构。
yum -y install filebeat-5.6.1-x86_64.rpm
filebeat也分为input和output,经过https://www.elastic.co/guide/en/beats/filebeat/5.6/configuration-filebeat-options.html官方文档的参考之后,filebeat的配置文件如下:
192.168.0.21的配置文件/etc/filebeat/filebeat.yml如下
filebeat.prospectors:
- input_type: log
paths:
- /data/access.log        #指定推送日志文件
exclude_lines: ["^DBG","^$"]
document_type: nginx-accesslog-021

output.redis:
hosts: ["192.168.0.22"]
port: "6379"
datatype: "list"
password: "123456"
key: "nginx-accesslog-021"  #为了后期日志处理,建议自定义key名称
db: 0
timeout: 5
192.168.0.22的配置文件/etc/filebeat/filebeat.yml如下
filebeat.prospectors:
- input_type: log
paths:
- /data/access.log        #指定推送日志文件
exclude_lines: ["^DBG","^$"]
document_type: nginx-accesslog-022

output.redis:
hosts: ["192.168.0.22"]
port: "6379"
password: "123456"
key: "nginx-accesslog-022"  #为了后期日志处理,建议自定义key名称
db: 1
timeout: 5
七、安装logstash
yum -y install logstash-5.6.1.rpm
我们先用logstash来处理非json格式的日志文件
logstash用来过滤和处理日志的插件是filter插件,这个插件中,我们主要用的是grok、和geoip插件,其他的还有mutate和date等
logstash处理非json格式的日志,是按照正则表达式来进行匹配出每个字段的。
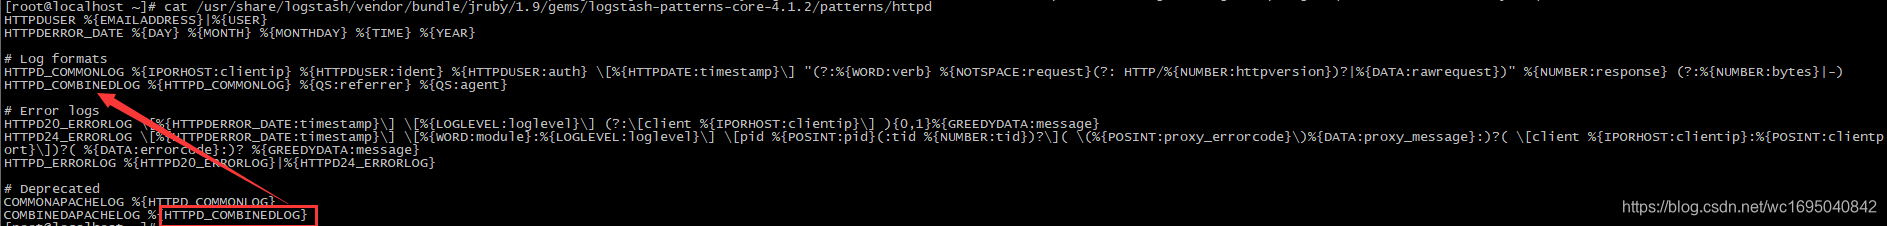
logstash本身自带了很多定义好的正则字段,在这个目录下:

如apache日志解析:logstash过滤解析apache日志
filter {
grok {
match => { "message" => "%{COMBINEDAPACHELOG}"}
}
}
Logstash内置的pattern的定义(嵌套调用)
再举个例子
%{IP:client}这意思是:用IP这则去匹配日志内容,匹配到的内容存储在key client里。
先来看一下默认的nginx日志的格式:
192.168.0.200 - - [24/Dec/2018:14:38:14 +0800] "GET /index.html HTTP/1.1" 200 612 "-" "Mozilla/5.0 (Windows NT 10.0; WOW64) AppleWebKit/537.36 (KHTML, like Gecko) Chrome/71.0.3578.98 Safari/537.36"
我们可以用官方的grok debugger来帮我们生成正则,http://grokdebug.herokuapp.com/discover?#
复制上面的这条nginx日志到网页中的input框中,然后点击discover,系统帮我们生成了正则表达式,我们发现和apache的是一样的。

增加修改logstash配置文件/etc/logstash/conf.d/nginx-access.conf,内容如下
input {
redis {
data_type => "list"
host => "192.168.0.22"
db => "0"
port => "6379"
key => "nginx-accesslog-021"
password => "123456"
}
}

input {
redis {
data_type => "list"
host => "192.168.0.22"
db => "1"
port => "6379"
key => "nginx-accesslog-022"
password => "123456"
}
}

filter {
grok {
match => { "message" => "%{COMBINEDAPACHELOG}" }
}
}

output {
if [type] == "nginx-accesslog-021" {
elasticsearch {
hosts => ["192.168.0.21:9200"]
index => "logstash-nginx-accesslog-021-%{+YYYY.MM.dd}"
}
stdout { codec => rubydebug }
}

if [type] == "nginx-accesslog-022" {
elasticsearch {
hosts => ["192.168.0.21:9200"]
index => "logstash-nginx-accesslog-022-%{+YYYY.MM.dd}"
}
stdout { codec => rubydebug }
}
}
这里用两个input插件分别从redis的不同db的key中取出收集到的日志,再经过grok插件过滤,最后根据不同的type输出到es的不同索引中。为了调试的方便,这里还加上了标准输出stdout。
八、安装kibana
yum -y install kibana-5.6.1-x86_64.rpm
修改kibana配置文件/etc/kibana/kibana.yml:
server.port: 5601
server.host: "192.168.0.21"
elasticsearch.url: "http://192.168.0.21:9200"
九、测试
1)先启动filebeat和redis
/etc/init.d/filebeat start./redis-server ../conf/redis.conf
2)生成nginx日志
为了方便,这里直接往21和22的nginx的日志文件中分别echo两条nginx日志:
echo '223.99.202.178 - - [24/Dec/2018:11:39:07 +0800] "POST /user/doLogin HTTP/1.1" 200 111 "https://www.hehehe.com/" "Mozilla/5.0 (Windows NT 6.1; Win64; x64) AppleWebKit/537.36 (KHTML, like Gecko) Chrome/70.0.3538.77 Safari/537.36"' >> /data/access.log
3)查看日志是否传到redis中
192.168.0.22:6379> select 0
OK
192.168.0.22:6379> keys *
1) "nginx-accesslog-021"
192.168.0.22:6379> llen nginx-accesslog-021
(integer) 2
192.168.0.22:6379> select 1
OK
192.168.0.22:6379[1]> keys *
1) "nginx-accesslog-022"
192.168.0.22:6379[1]> llen nginx-accesslog-022
(integer) 2
192.168.0.22:6379[1]>
可以看到两台服务器的nginx日志都已经传到了redis中
4)用调试模式启动logstash,查看日志的处理情况
[root@localhost elasticsearch-head]# /usr/share/logstash/bin/logstash -f /etc/logstash/conf.d/nginx-access.conf
WARNING: Could not find logstash.yml which is typically located in $LS_HOME/config or /etc/logstash. You can specify the path using --path.settings. Continuing using the defaults
Could not find log4j2 configuration at path //usr/share/logstash/config/log4j2.properties. Using default config which logs errors to the console
{
"request" => "/user/doLogin",
"agent" => "\"Mozilla/5.0 (Windows NT 6.1; Win64; x64) AppleWebKit/537.36 (KHTML, like Gecko) Chrome/70.0.3538.77 Safari/537.36\"",
"offset" => 3642,
"auth" => "-",
"ident" => "-",
"input_type" => "log",
"verb" => "POST",
"source" => "/data/access.log",
"message" => "223.99.202.178 - - [24/Dec/2018:11:39:07 +0800] \"POST /user/doLogin HTTP/1.1\" 200 111 \"https://www.hehehe.com/\" \"Mozilla/5.0 (Windows NT 6.1; Win64; x64) AppleWebKit/537.36 (KHTML, like Gecko) Chrome/70.0.3538.77 Safari/537.36\"",
"type" => "nginx-accesslog-022",
"referrer" => "\"https://www.hehehe.com/\"",
"@timestamp" => 2018-12-27T05:56:15.319Z,
"response" => "200",
"bytes" => "111",
"clientip" => "223.99.202.178",
"beat" => {
"name" => "localhost.localdomain",
"hostname" => "localhost.localdomain",
"version" => "5.6.1"
},
"@version" => "1",
"httpversion" => "1.1",
"timestamp" => "24/Dec/2018:11:39:07 +0800"
}
{
"request" => "/user/doLogin",
"agent" => "\"Mozilla/5.0 (Windows NT 6.1; Win64; x64) AppleWebKit/537.36 (KHTML, like Gecko) Chrome/70.0.3538.77 Safari/537.36\"",
"offset" => 3870,
"auth" => "-",
"ident" => "-",
"input_type" => "log",
"verb" => "POST",
"source" => "/data/access.log",
"message" => "223.99.202.178 - - [24/Dec/2018:11:39:07 +0800] \"POST /user/doLogin HTTP/1.1\" 200 111 \"https://www.hehehe.com/\" \"Mozilla/5.0 (Windows NT 6.1; Win64; x64) AppleWebKit/537.36 (KHTML, like Gecko) Chrome/70.0.3538.77 Safari/537.36\"",
"type" => "nginx-accesslog-022",
"referrer" => "\"https://www.hehehe.com/\"",
"@timestamp" => 2018-12-27T05:56:15.319Z,
"response" => "200",
"bytes" => "111",
"clientip" => "223.99.202.178",
"beat" => {
"name" => "localhost.localdomain",
"hostname" => "localhost.localdomain",
"version" => "5.6.1"
},
"@version" => "1",
"httpversion" => "1.1",
"timestamp" => "24/Dec/2018:11:39:07 +0800"
}
{
"request" => "/user/doLogin",
"agent" => "\"Mozilla/5.0 (Windows NT 6.1; Win64; x64) AppleWebKit/537.36 (KHTML, like Gecko) Chrome/70.0.3538.77 Safari/537.36\"",
"offset" => 21195,
"auth" => "-",
"ident" => "-",
"input_type" => "log",
"verb" => "POST",
"source" => "/data/access.log",
"message" => "223.99.202.178 - - [24/Dec/2018:11:39:07 +0800] \"POST /user/doLogin HTTP/1.1\" 200 111 \"https://www.hehehe.com/\" \"Mozilla/5.0 (Windows NT 6.1; Win64; x64) AppleWebKit/537.36 (KHTML, like Gecko) Chrome/70.0.3538.77 Safari/537.36\"",
"type" => "nginx-accesslog-021",
"referrer" => "\"https://www.hehehe.com/\"",
"@timestamp" => 2018-12-27T05:54:18.986Z,
"response" => "200",
"bytes" => "111",
"clientip" => "223.99.202.178",
"beat" => {
"name" => "localhost",
"hostname" => "localhost",
"version" => "5.6.1"
},
"@version" => "1",
"httpversion" => "1.1",
"timestamp" => "24/Dec/2018:11:39:07 +0800"
}
{
"request" => "/user/doLogin",
"agent" => "\"Mozilla/5.0 (Windows NT 6.1; Win64; x64) AppleWebKit/537.36 (KHTML, like Gecko) Chrome/70.0.3538.77 Safari/537.36\"",
"offset" => 21423,
"auth" => "-",
"ident" => "-",
"input_type" => "log",
"verb" => "POST",
"source" => "/data/access.log",
"message" => "223.99.202.178 - - [24/Dec/2018:11:39:07 +0800] \"POST /user/doLogin HTTP/1.1\" 200 111 \"https://www.hehehe.com/\" \"Mozilla/5.0 (Windows NT 6.1; Win64; x64) AppleWebKit/537.36 (KHTML, like Gecko) Chrome/70.0.3538.77 Safari/537.36\"",
"type" => "nginx-accesslog-021",
"referrer" => "\"https://www.hehehe.com/\"",
"@timestamp" => 2018-12-27T05:54:18.986Z,
"response" => "200",
"bytes" => "111",
"clientip" => "223.99.202.178",
"beat" => {
"name" => "localhost",
"hostname" => "localhost",
"version" => "5.6.1"
},
"@version" => "1",
"httpversion" => "1.1",
"timestamp" => "24/Dec/2018:11:39:07 +0800"
}
可以看到,logstash已经从redis中取到数据,这时候去查看redis
192.168.0.22:6379[1]> select 0
OK
192.168.0.22:6379> keys *
(empty list or set)
192.168.0.22:6379> select 1
OK
192.168.0.22:6379[1]> keys *
(empty list or set)
192.168.0.22:6379[1]>
和预期一样,redis中的数据已经被logstash取走了。
5)查看es中的数据
这时候的 elasticsearch集群如下图
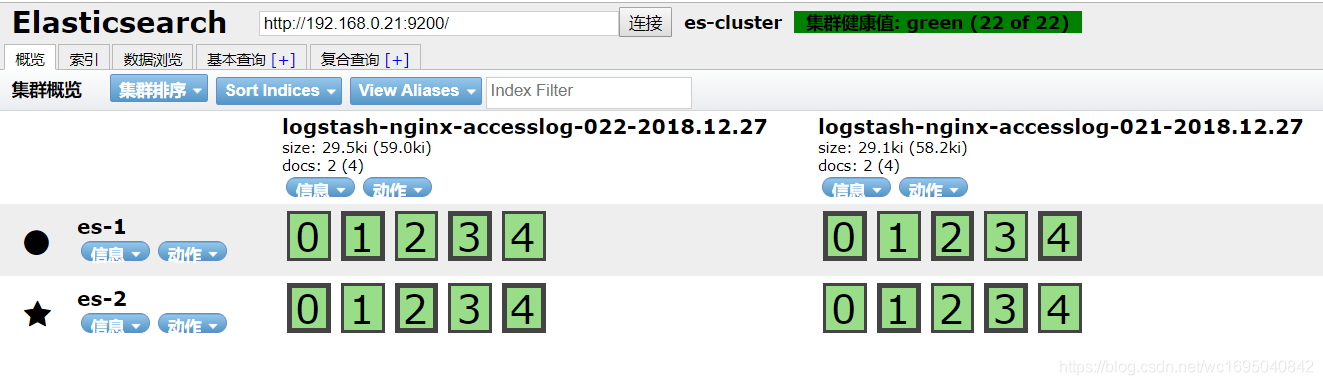
生成了两个index索引,数据已经来到了es中。
6)启动kinaba查看数据
/etc/init.d/kibana start
用浏览器访问kibana,http://192.168.0.21:5601
在index pattern中输入192.168.0.21的nginx索引进行匹配
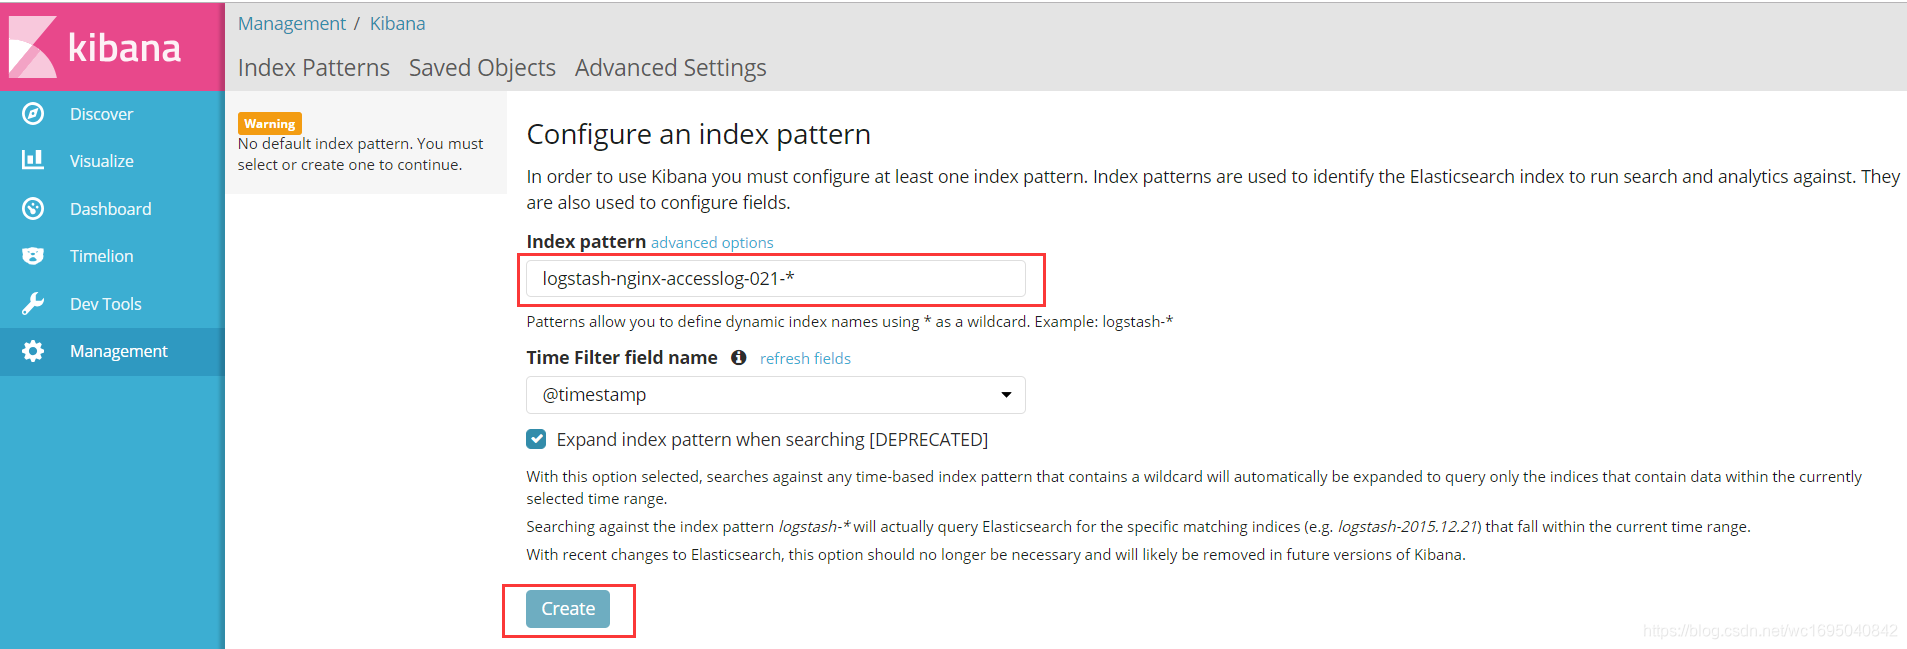

这时候在kibana上已经找到了刚才收集的日志
十、用GeoIP插件展示客户端IP地址
我们通过logstash收集的nginx access
log中已经包含了客户端IP的数据,但是只有这个IP还不够,要在kibana中显示请求来源的地理位置还需要借助GeoIP数据库来实现。GeoIP是最常见的免费IP地址归类查询库,当然也有收费的版本。GeoIP库根据地址提供对应的地域信息,包括国家,省市,经纬度等,对于可视化地图和区域统计非常有用。
1)下载并解压地址数据文件
在logstash2版本的时候使用的是
http://geolite.maxmind.com/download/geoip/database/GeoLiteCity.dat.gz
logstash5版本时候更换为了
https://geolite.maxmind.com/download/geoip/database/GeoLite2-City.tar.gz
cd /etc/logstash/
wget https://geolite.maxmind.com/download/geoip/database/GeoLite2-City.tar.gz
gunzip GeoLite2-City.tar.gz
tar -xvf GeoLite2-City.tar
修改logstash配置文件/etc/logstash/conf.d/nginx-access.conf使用GeoIP插件,并把message字段用mutate插件移除(感觉message字段有点重复多余)
input {
redis {
data_type => "list"
host => "192.168.0.22"
db => "0"
port => "6379"
key => "nginx-accesslog-021"
password => "123456"
}
}

input {
redis {
data_type => "list"
host => "192.168.0.22"
db => "1"
port => "6379"
key => "nginx-accesslog-022"
password => "123456"
}
}

filter {
grok {
match => { "message" => "%{COMBINEDAPACHELOG}" }
}

if [clientip] !~ "^127\.|^192\.168\.|^172\.1[6-9]\.|^172\.2[0-9]\.|^172\.3[01]\.|^10\." {   #排除内网地址
geoip {
source => "clientip"   #设置解析IP地址的字段
target => "geoip"      #将geoip数据保存到一个字段内
database => "/etc/logstash/GeoLite2-City_20181218/GeoLite2-City.mmdb"  #IP地址数据库
}
}

mutate {
remove_field => "message"
}
}

output {
if [type] == "nginx-accesslog-021" {
elasticsearch {
hosts => ["192.168.0.21:9200"]
index => "logstash-nginx-accesslog-021-%{+YYYY.MM.dd}"
}
stdout { codec => rubydebug }
}

if [type] == "nginx-accesslog-022" {
elasticsearch {
hosts => ["192.168.0.21:9200"]
index => "logstash-nginx-accesslog-022-%{+YYYY.MM.dd}"
}
stdout { codec => rubydebug }
}
}
配置文件我们配置好了,这时候我们再echo两条日志到第一台服务器的/data/access.log,一条IP为公网地址,另一条IP为内网地址
echo '223.99.202.178 - - [24/Dec/2018:11:39:07 +0800] "POST /user/doLogin HTTP/1.1" 200 111 "https://www.hehehe.com/" "Mozilla/5.0 (Windows NT 6.1; Win64; x64) AppleWebKit/537.36 (KHTML, like Gecko) Chrome/70.0.3538.77 Safari/537.36"' >> /data/access.logecho '192.168.1.210 - - [24/Dec/2018:11:39:07 +0800] "POST /user/doLogin HTTP/1.1" 200 111 "https://www.hehehe.com/" "Mozilla/5.0 (Windows NT 6.1; Win64; x64) AppleWebKit/537.36 (KHTML, like Gecko) Chrome/70.0.3538.77 Safari/537.36"' >> /data/access.log
再以调试模式启动logstash
[root@localhost elasticsearch-head]# /usr/share/logstash/bin/logstash -f /etc/logstash/conf.d/nginx-access.conf
WARNING: Could not find logstash.yml which is typically located in $LS_HOME/config or /etc/logstash. You can specify the path using --path.settings. Continuing using the defaults
Could not find log4j2 configuration at path //usr/share/logstash/config/log4j2.properties. Using default config which logs errors to the console
{
"request" => "/user/doLogin",
"agent" => "\"Mozilla/5.0 (Windows NT 6.1; Win64; x64) AppleWebKit/537.36 (KHTML, like Gecko) Chrome/70.0.3538.77 Safari/537.36\"",
"geoip" => {
"city_name" => "Jinan",
"timezone" => "Asia/Shanghai",
"ip" => "223.99.202.178",
"latitude" => 36.6683,
"country_name" => "China",
"country_code2" => "CN",
"continent_code" => "AS",
"country_code3" => "CN",
"region_name" => "Shandong",
"location" => {
"lon" => 116.9972,
"lat" => 36.6683
},
"region_code" => "SD",
"longitude" => 116.9972
},
"offset" => 22106,
"auth" => "-",
"ident" => "-",
"input_type" => "log",
"verb" => "POST",
"source" => "/data/access.log",
"type" => "nginx-accesslog-021",
"referrer" => "\"https://www.hehehe.com/\"",
"@timestamp" => 2018-12-27T07:01:09.563Z,
"response" => "200",
"bytes" => "111",
"clientip" => "223.99.202.178",
"beat" => {
"name" => "localhost",
"hostname" => "localhost",
"version" => "5.6.1"
},
"@version" => "1",
"httpversion" => "1.1",
"timestamp" => "24/Dec/2018:11:39:07 +0800"
}
{
"request" => "/user/doLogin",
"agent" => "\"Mozilla/5.0 (Windows NT 6.1; Win64; x64) AppleWebKit/537.36 (KHTML, like Gecko) Chrome/70.0.3538.77 Safari/537.36\"",
"offset" => 22333,
"auth" => "-",
"ident" => "-",
"input_type" => "log",
"verb" => "POST",
"source" => "/data/access.log",
"type" => "nginx-accesslog-021",
"referrer" => "\"https://www.hehehe.com/\"",
"@timestamp" => 2018-12-27T07:01:09.563Z,
"response" => "200",
"bytes" => "111",
"clientip" => "192.168.1.210",
"beat" => {
"name" => "localhost",
"hostname" => "localhost",
"version" => "5.6.1"
},
"@version" => "1",
"httpversion" => "1.1",
"timestamp" => "24/Dec/2018:11:39:07 +0800"
}
可以看到,公网地址是有geoip这个字段的,字段里包含了该源IP地址的所属的大洲、国家、省份、城市、经纬度等信息。内网地址则没有geoip字段。而且两条数据的message字段都被移除了,证明上面的logstash配置文件没有问题。
然后去kibana中展示这个公网ip地址(这里只用了1条进行展示,如果是线上的比较多的日志,效果会更好)

至此,ELK收集非josn格式的日志就完成了。
十一、nginx日志格式为json的日志收集
之所以要把日志写成json格式再收集是因为json格式的日志不需要正则表达式去匹配,可以省去logstash匹配正则所用的时间,也降低了logstash服务器的硬件开销。nginx的日志可以写成json格式,所以最好将nginx的日志配置成json格式的再进行收集。
nginx的配置文件中增加一条如下的日志配置:
log_format access_json '{"clientip":"$remote_addr","timestamp":"$time_local","host":"$server_addr","request":"$request","size":"$body_bytes_sent","responsetime":"$request_time","upstreamaddr":"$upstream_addr","upstreamtime":"$upstream_response_time","http_host":"$http_host","url":"$uri","xff":"$http_x_forwarded_for","referer":"$http_referer","status":"$status","useragent":"$http_user_agent"}';
再调用这个日志格式
access_log /data/access.log access_json;
然后重新加载nginx
/usr/local/nginx/sbin/nginx -s reload
具体的参数说明
参数                      说明                                         示例
$remote_addr             客户端地址                                    211.28.65.253
$time_local              访问时间和时区                                27/Dec/2018:17:07:47 +0800
$server_addr             请求的服务器地址                              192.168.0.21
$request                 请求的URI和HTTP协议                           "GET /index.html HTTP/1.1"
$body_bytes_sent         发送给客户端文件内容大小                      612
$request_time            整个请求的总时间                              0.205
$upstream_addr           后台upstream的地址,即真正提供服务的主机地址  10.10.10.100:80
$upstream_response_time  请求过程中,upstream响应时间                  0.002
$http_host               请求地址,即浏览器中你输入的地址(IP或域名)  www.wang.com 192.168.100.100
$uri                     请求URI                                       /index.html
$http_x_forwarded_for    当你使用了代理时,web服务器就不知道你的真实IP了,为了避免这个情况,代理服务器通常会增加一个叫做x_forwarded_for的头信息,把连接它的客户端IP(即你的上网机器IP)加到这个头信息里,这样就能保证网站的web服务器能获取到真实IP
$http_referer            url跳转来源                                   https://www.baidu.com/
$status                  HTTP请求状态                                  200
$http_user_agent         用户终端浏览器等信息                          "useragent":"Mozilla/5.0 (Windows NT 10.0; WOW64) AppleWebKit/537.36 (KHTML, like Gecko) Chrome/71.0.3578.98 Safari/537.36"
filebeat的配置文件/etc/filebeat/filebeat.yml不变
filebeat.prospectors:
- input_type: log
paths:
- /data/access.log        #指定推送日志文件
exclude_lines: ["^DBG","^$"]
document_type: nginx-accesslog-021

output.redis:

hosts: ["192.168.0.22"]
port: "6379"
datatype: "list"
password: "123456"
key: "nginx-accesslog-021"  #为了后期日志处理,建议自定义key名称
db: 0
timeout: 5
这里我们先把filebeat给关闭,因为下面需要手动修改日志的IP地址。
/etc/init.d/filebeat stop
新增logstash的配置文件/etc/logstash/conf.d/nginx-access-json.conf
input {
redis {
data_type => "list"
host => "192.168.0.22"
db => "0"
port => "6379"
key => "nginx-accesslog-021"
password => "123456"
}
}

input {
redis {
data_type => "list"
host => "192.168.0.22"
db => "1"
port => "6379"
key => "nginx-accesslog-022"
password => "123456"
}
}

filter {
json {
source => "message"
}

mutate {
remove_field => "message"
}
}

output {
if [type] == "nginx-accesslog-021" {
elasticsearch {
hosts => ["192.168.0.21:9200"]
index => "logstash-nginx-accesslog-021-%{+YYYY.MM.dd}"
}
stdout { codec => rubydebug }
}

if [type] == "nginx-accesslog-022" {
elasticsearch {
hosts => ["192.168.0.21:9200"]
index => "logstash-nginx-accesslog-022-%{+YYYY.MM.dd}"
}
stdout { codec => rubydebug }
}
}
用浏览器访问一下nginx的index.html,在/data/access.log中生成一条新日志,我们手动把这条日志的IP改成公网IP,如下:
{"clientip":"106.9.119.46","timestamp":"28/Dec/2018:15:48:22 +0800","host":"192.168.0.21","request":"GET /favicon.ico HTTP/1.1","size":"572","responsetime":"0.000","upstreamaddr":"-","upstreamtime":"-","http_host":"abc.def.com","url":"/favicon.ico","xff":"-","referer":"http://abc.def.com/index.html","status":"200","useragent":"Mozilla/5.0 (Windows NT 10.0; WOW64) AppleWebKit/537.36 (KHTML, like Gecko) Chrome/71.0.3578.98 Safari/537.36"}
启动filebeat:
/etc/init.d/filebeat start
以debug模式启动logstash
[root@localhost elasticsearch-head]# /usr/share/logstash/bin/logstash -f /etc/logstash/conf.d/nginx-access-json.conf
WARNING: Could not find logstash.yml which is typically located in $LS_HOME/config or /etc/logstash. You can specify the path using --path.settings. Continuing using the defaults
Could not find log4j2 configuration at path //usr/share/logstash/config/log4j2.properties. Using default config which logs errors to the console
{
"request" => "GET /favicon.ico HTTP/1.1",
"upstreamaddr" => "-",
"referer" => "http://abc.def.com/index.html",
"geoip" => {
"ip" => "106.9.119.46",
"latitude" => 34.7725,
"country_name" => "China",
"country_code2" => "CN",
"continent_code" => "AS",
"country_code3" => "CN",
"location" => {
"lon" => 113.7266,
"lat" => 34.7725
},
"longitude" => 113.7266
},
"offset" => 40236,
"input_type" => "log",
"useragent" => "Mozilla/5.0 (Windows NT 10.0; WOW64) AppleWebKit/537.36 (KHTML, like Gecko) Chrome/71.0.3578.98 Safari/537.36",
"source" => "/data/access.log",
"type" => "nginx-accesslog-021",
"http_host" => "abc.def.com",
"url" => "/favicon.ico",
"@timestamp" => 2018-12-28T07:58:33.594Z,
"size" => "572",
"clientip" => "106.9.119.46",
"beat" => {
"name" => "localhost",
"hostname" => "localhost",
"version" => "5.6.1"
},
"@version" => "1",
"host" => "192.168.0.21",
"responsetime" => "0.000",
"xff" => "-",
"upstreamtime" => "-",
"timestamp" => "28/Dec/2018:15:48:22 +0800",
"status" => "200"
}
接下去的kibana的展示就像之前的一样操作

- centos7 安装elk日志分析系统
- 搭建ELK日志分析系统(一)-Elasticsearch安装
- ELK日志分析系统 介绍 安装配置
- ELK日志分析系统安装【6.x】
- ELK日志分析系统实战(一)安装和部署
- 搭建ELK日志分析系统(四)-kibana安装和使用
- ELK 日志分析系统 安装
- 1-ELK安装及使用教程(搭建日志分析系统)
- centos7搭建ELK开源实时日志分析系统 推荐
- ELK日志分析系统安装,多节点(二)
- Centos7 之安装Logstash ELK stack 日志管理系统
- 搭建ELK日志分析系统(三)-Logstash安装和使用
- ELK日志分析系统安装,单节点(一)
- 集中式日志分析系统ELK安装部署
- ELK日志分析系统实战(一)安装和部署
- ELK日志分析系统(mark)
- ELK 日志分析系统
- Elk实时日志分析平台5.0版本源码安装配置
- ELK 日志分析系统
- ELK 日志分析系统