ELK日志分析系统实战(一)安装和部署
2016-03-31 16:28
1001 查看
在日常的运维管理活动,日志非常的重要,当发现error时可以从日志了解报错并及时解决。日志分为系统日志,应用日志,和安全日志,经常的分析日志可以了解服务器的硬件状况,性能以及安全,从而采取预防措施及时纠正任务。
通常情况下,日志被分散到不同的存储设备上,而企业内部的服务器,少则十几台多则成千上百,如果采取最传统的方式登录每台服务器进行查看,对运维来说难度大劳动强度也大,而且不易管理容易出错不易管理,所以需要一个进行集中化管理日志的解决方案。
开源实时日志分析平台 ELK 是ELK套件(ELK stack)是指ElasticSearch、Logstash和Kibana三件套。这三个软件可以组成一套日志分析和监控工具。
Elasticsearch是个开源分布式搜索引擎,它的特点有:分布式,零配置,自动发现,索引自动分片,索引副本机制,restful风格接口,多数据源,自动搜索负载等。
Logstash是一个完全开源的工具,他可以对你的日志进行收集、过滤,并将其存储供以后使用(如,搜索)。
Kibana 也是一个开源和免费的工具,它Kibana可以为 Logstash 和 ElasticSearch 提供的日志分析友好的 Web 界面,可以帮助您汇总、分析和搜索重要数据日志。
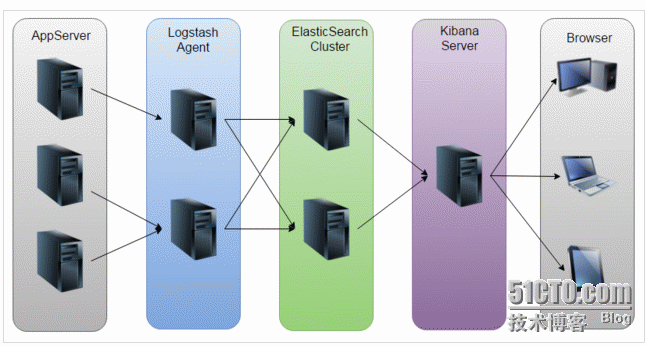
如图:Logstash收集AppServer产生的Log,并存放到ElasticSearch集群中,而Kibana则从ES集群中查询数据生成图表,再返回给Browser。
(一)ELK平台搭建准备
1.1 平台环境:
OS:CentOS release 6.4(Final)
ElasticSearch:2.2.1
Logstash:2.2.2
Kibana:4.4.2
JRE:1.8.2
注:由于Logstash的运行依赖于Java环境, 而Logstash 1.5以上版本不低于java 1.7,因此推荐使用最新版本的Java。因为我们只需要Java的运行环境,所以可以只安装JRE,不过这里我依然使用JDK
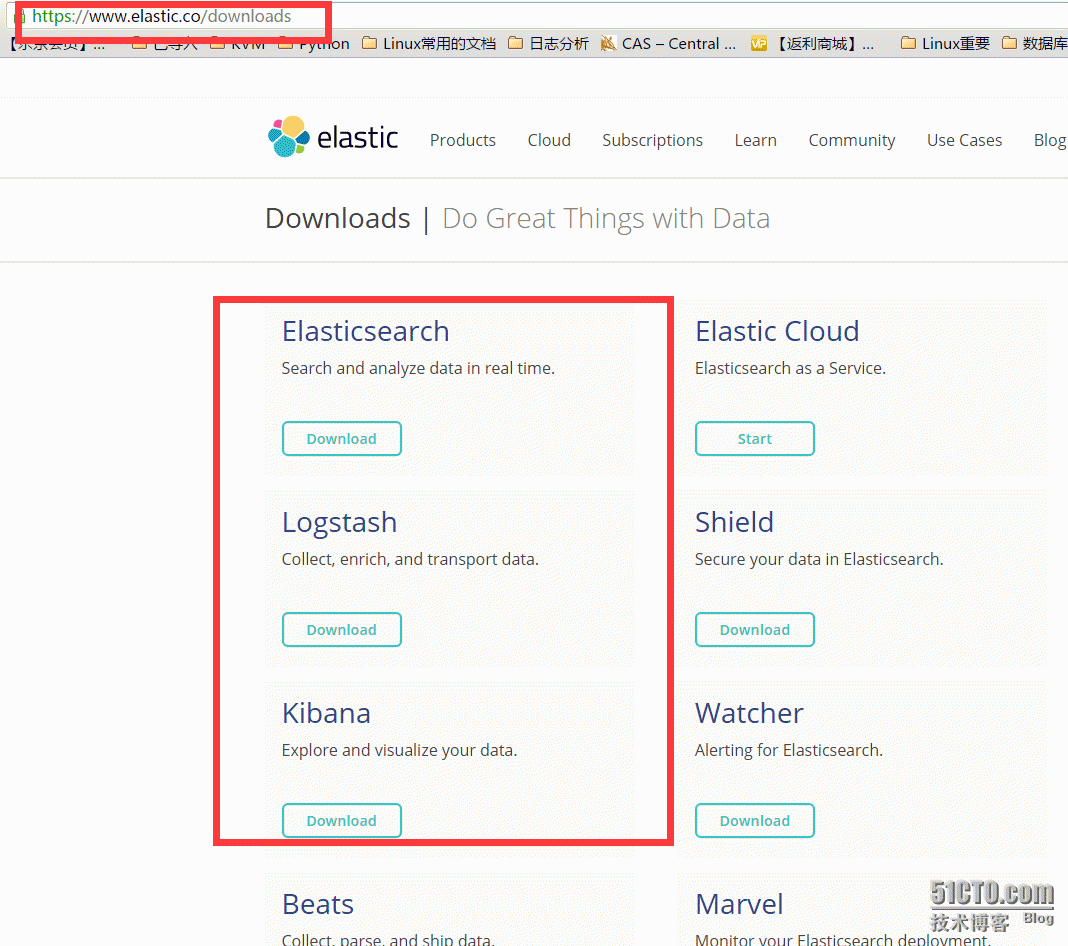
1.2 ELK下载:https://www.elastic.co/downloads/
由于三个软件各自的版本号太多,建议采用ElasticSearch官网推荐的搭配组。具体下载如下图一图二:
图一
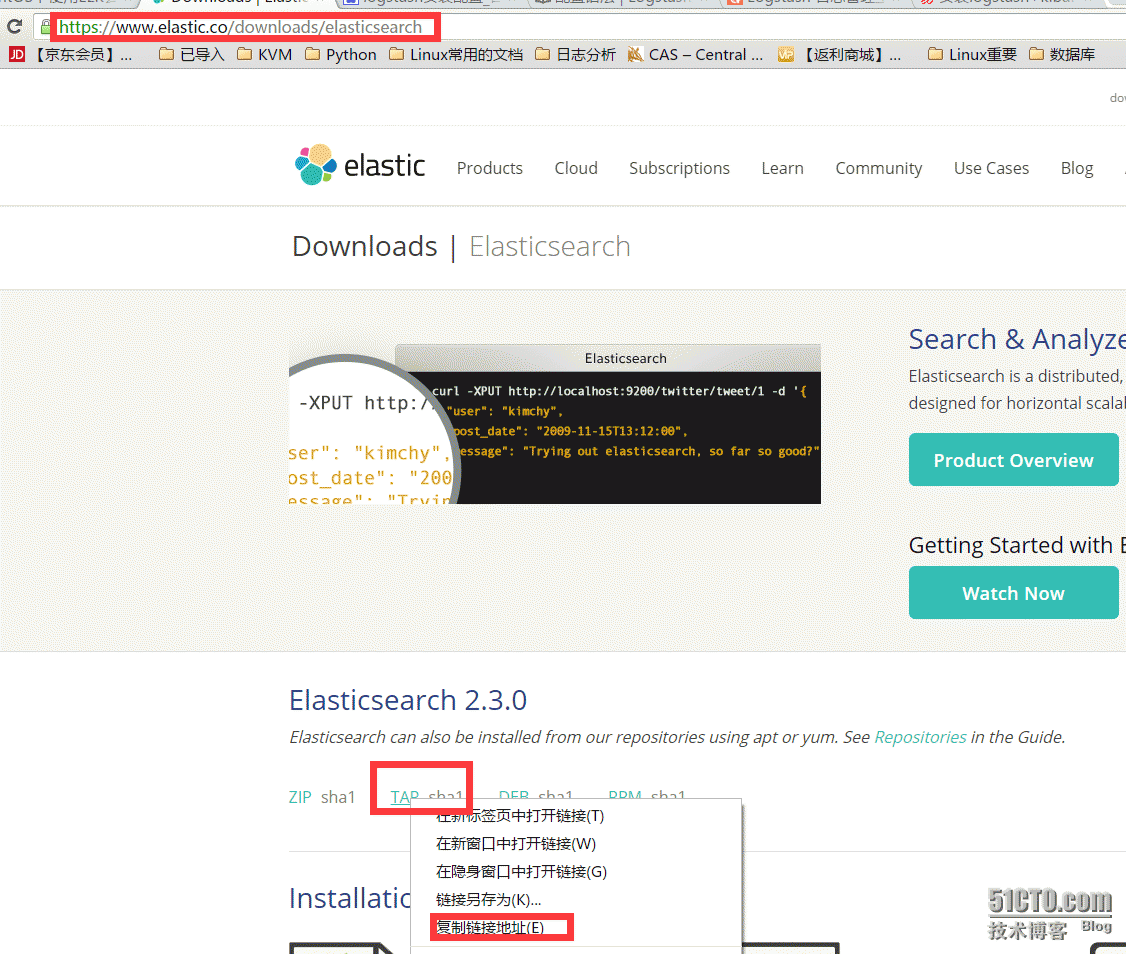
图二直接下载或使用linux自带的下载工具wget进行下载
1,wget https://download.elasticsearch.org/elasticsearch/release/org/elasticsearch/distribution/tar/elasticsearch/2.2.1/elasticsearch-2.2.1.tar.gz 2,wget https://download.elastic.co/logstash/logstash/logstash-2.2.2.tar.gz 3,wget https://download.elastic.co/kibana/kibana/kibana-4.4.2-linux-x64.tar.gz
1.3防火墙的配置:建议最好关闭本机防火墙iptables
(二)安装部署ELK平台
2.1安装部署jdk(具体可以参考http://liqingbiao.blog.51cto.com/3044896/1734612)
2.2安装Logstash具体步骤如下:
Logstash的功能如下:
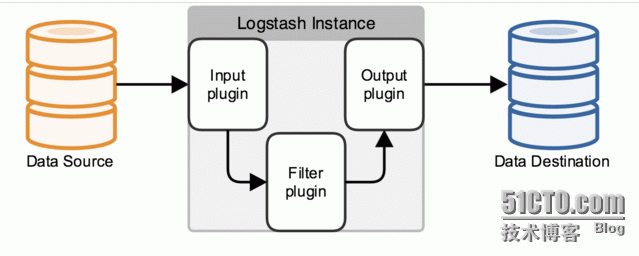
其实它就是一个收集器而已,我们需要为它指定Input和Output(当然Input和Output可以为多个)。由于我们需要把Java代码中Log4j的日志输出到ElasticSearch中,因此这里的Input就是Log4j,而Output就是ElasticSearch。
(1)安装Logstash
(4)对logstash进行测试
2.3安装Elasticsearch
(1)安装Elasticsearch.必须注意不能使用root账户,要使用普通用户本文以appuser用户进行测试。
出现标红的即为正常,传输端口为9300接受http请求的端口为9200,按ctrl+C停止,加-d或&以后台的方式进行启动Elasticsearch
(4)验证启动:验证启动有两种方式:一种通过本机进行访问,另一种通过浏览器进行访问,接下来一一介绍。
方法二:通过浏览器访问:
(5)创建Elasticsearch索引
a,由于刚刚安装了head插件,它是一个用浏览器跟Elasticsearch交互的插件,可以查看集群状态,集群的内容,执行搜索和普通 的rest请求等,可以通过:IP:9200/_plugin/head页面进行查看集群状态:
b,点击索引,进行创建
2.4安装Kibana
(1)安装Kibana
[root@zabbix software]# tar zxvf kibana-4.4.2-linux-x64.tar.gz -C /usr/local/
[root@zabbix local]# mv kibana-4.4.2-linux-x64/ kibana
(2)配置kibana
(3)启动Kibana并进行测试访问
使用http://kibanaServerIP:5601访问Kibana,登录后,首先,配置一个索引,默认,Kibana的数据被指向Elasticsearch,使用默认的logstash-*的索引名称,并且是基于时间的,点击“Create”即可。
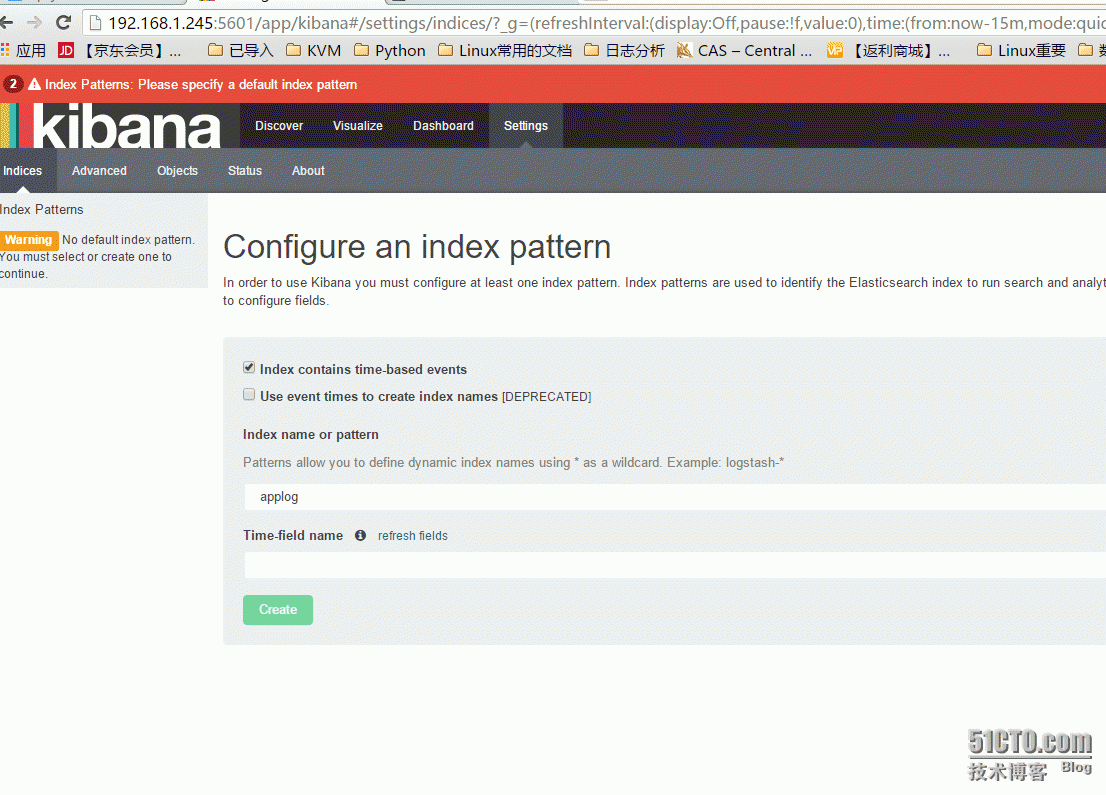
看到如下界面说明索引创建完成
至此ELK平台部署完成。
通常情况下,日志被分散到不同的存储设备上,而企业内部的服务器,少则十几台多则成千上百,如果采取最传统的方式登录每台服务器进行查看,对运维来说难度大劳动强度也大,而且不易管理容易出错不易管理,所以需要一个进行集中化管理日志的解决方案。
开源实时日志分析平台 ELK 是ELK套件(ELK stack)是指ElasticSearch、Logstash和Kibana三件套。这三个软件可以组成一套日志分析和监控工具。
Elasticsearch是个开源分布式搜索引擎,它的特点有:分布式,零配置,自动发现,索引自动分片,索引副本机制,restful风格接口,多数据源,自动搜索负载等。
Logstash是一个完全开源的工具,他可以对你的日志进行收集、过滤,并将其存储供以后使用(如,搜索)。
Kibana 也是一个开源和免费的工具,它Kibana可以为 Logstash 和 ElasticSearch 提供的日志分析友好的 Web 界面,可以帮助您汇总、分析和搜索重要数据日志。
如图:Logstash收集AppServer产生的Log,并存放到ElasticSearch集群中,而Kibana则从ES集群中查询数据生成图表,再返回给Browser。
(一)ELK平台搭建准备
1.1 平台环境:
OS:CentOS release 6.4(Final)
ElasticSearch:2.2.1
Logstash:2.2.2
Kibana:4.4.2
JRE:1.8.2
注:由于Logstash的运行依赖于Java环境, 而Logstash 1.5以上版本不低于java 1.7,因此推荐使用最新版本的Java。因为我们只需要Java的运行环境,所以可以只安装JRE,不过这里我依然使用JDK
1.2 ELK下载:https://www.elastic.co/downloads/
由于三个软件各自的版本号太多,建议采用ElasticSearch官网推荐的搭配组。具体下载如下图一图二:
图一
图二直接下载或使用linux自带的下载工具wget进行下载
1,wget https://download.elasticsearch.org/elasticsearch/release/org/elasticsearch/distribution/tar/elasticsearch/2.2.1/elasticsearch-2.2.1.tar.gz 2,wget https://download.elastic.co/logstash/logstash/logstash-2.2.2.tar.gz 3,wget https://download.elastic.co/kibana/kibana/kibana-4.4.2-linux-x64.tar.gz
1.3防火墙的配置:建议最好关闭本机防火墙iptables
[root@zabbix software]# service iptables stop
[root@zabbix software]# chkconfig iptables off
[root@zabbix software]# vim /etc/sysconfig/selinux
# This file controls the state of SELinux on the system.
# SELINUX= can take one of these three values:
#     enforcing - SELinux security policy is enforced.
#     permissive - SELinux prints warnings instead of enforcing.
#     disabled - No SELinux policy is loaded.
SELINUX=disabled
# SELINUXTYPE= can take one of these two values:
#     targeted - Targeted processes are protected,
#     mls - Multi Level Security protection.
SELINUXTYPE=targeted
(二)安装部署ELK平台
2.1安装部署jdk(具体可以参考http://liqingbiao.blog.51cto.com/3044896/1734612)
[root@zabbix software]# wget http://sdlc-esd.oracle.com/ESD6/JSCDL/jdk/8u77-b03/jre-8u77-linux-i586.rpm?GroupName=JSC&FilePath=/ESD6/JSCDL/jdk/8u77-b03/jre-8u77-linux-i586.rpm&BHost=javadl.sun.com&File=jre-8u77-linux-i586.rpm&AuthParam=1459403700_48ef84d5bcfce1580a2e5eac12bb9eb3&ext=.rpm [root@localhost install]# rpm -ivh jdk-8u51-linux-x64.rpm
Preparing...                ########################################### [100%]
1:jdk1.8.0_51            ########################################### [100%]
Unpacking JAR files...
rt.jar...
jsse.jar...
charsets.jar...
tools.jar...
localedata.jar...
jfxrt.jar...
plugin.jar...
javaws.jar...
deploy.jar...
[root@localhost install]# vi /etc/profile
# /etc/profile
# System wide environment and startup programs, for login setup
# Functions and aliases go in /etc/bashrc
# It's NOT a good idea to change this file unless you know what you
# are doing. It's much better to create a custom.sh shell script in
# /etc/profile.d/ to make custom changes to your environment, as this
# will prevent the need for merging in future updates.
pathmunge () {
case ":${PATH}:" in
*:"$1":*)
;;
*)
if [ "$2" = "after" ] ; then
PATH=$PATH:$1
else
PATH=$1:$PATH
fi
esac
}
"/etc/profile" 78L, 1796C
# By default, we want umask to get set. This sets it for login shell
# Current threshold for system reserved uid/gids is 200
# You could check uidgid reservation validity in
# /usr/share/doc/setup-*/uidgid file
if [ $UID -gt 199 ] && [ "`id -gn`" = "`id -un`" ]; then
umask 002
else
umask 022
fi
for i in /etc/profile.d/*.sh ; do
if [ -r "$i" ]; then
if [ "${-#*i}" != "$-" ]; then
. "$i"
else
. "$i" >/dev/null 2>&1
fi
fi
done
unset i
unset -f pathmunge

export JAVA_HOME=/usr/java/jdk1.8.0_51
export PATH=$JAVA_HOME/bin:$PATH
export CLASSPATH=$JAVA_HOME/lib:.:$CLASSPATH
[root@zabbix software]# java -version
java version "1.8.0_51"
Java(TM) SE Runtime Environment (build 1.8.0_51-b16)
Java HotSpot(TM) 64-Bit Server VM (build 25.51-b03, mixed mode)
2.2安装Logstash具体步骤如下:
Logstash的功能如下:
其实它就是一个收集器而已,我们需要为它指定Input和Output(当然Input和Output可以为多个)。由于我们需要把Java代码中Log4j的日志输出到ElasticSearch中,因此这里的Input就是Log4j,而Output就是ElasticSearch。
(1)安装Logstash
[root@zabbix software]# tar zxvf logstash-2.2.2.tar.gz -C /usr/local/
[root@zabbix local]# mv logstash-2.2.2/ logstash
(2)测试Logstash,如下显示正确
[root@zabbix local]# /usr/local/logstash/bin/logstash -e 'input { stdin { } } output { stdout {} }'
Settings: Default pipeline workers: 2
Logstash startup completed
hello world
2016-03-31T06:03:54.447Z zabbix.com hello world
how are you
2016-03-31T06:04:09.225Z zabbix.com how are you(3)创建logstash配置文件目录[root@zabbix local]# mkdir /usr/local/logstash/etc/
[root@zabbix etc]# vim logstash-simple.conf
input { stdin { } }
output {
elasticsearch {hosts => "192.168.1.245" }
stdout { codec=> rubydebug }
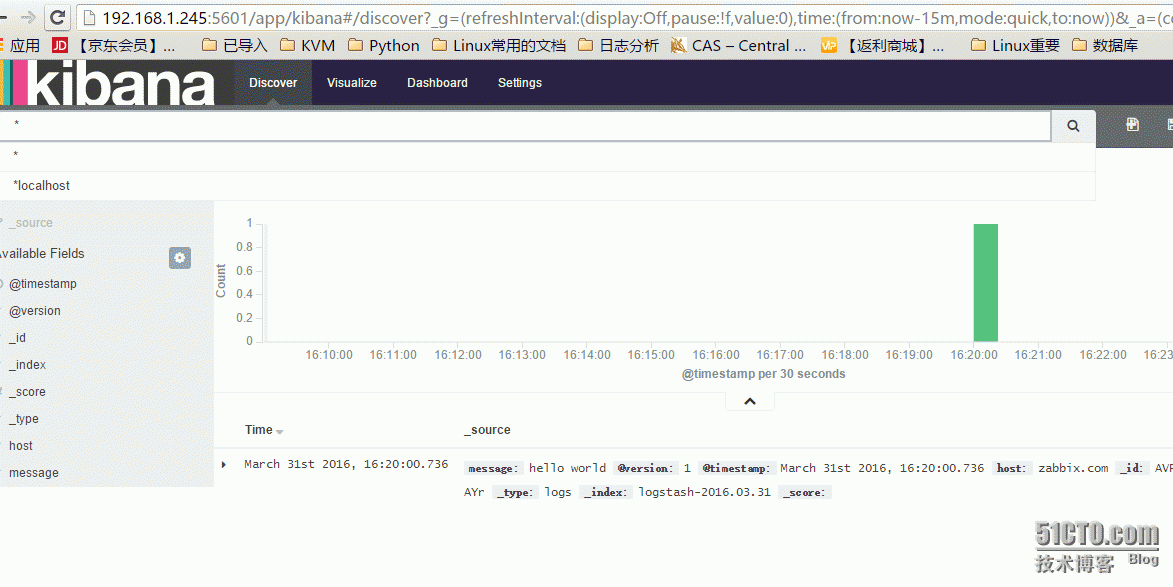
}Logstash使用input和output定义收集日志时的输入和输出的相关配置,本例中input定义了一个叫"stdin"的input,output定义一个叫"stdout"的output。无论我们输入什么字符,Logstash都会按照某种格式来返回我们输入的字符,其中output被定义为"stdout"并使用了codec参数来指定logstash输出格式。(4)对logstash进行测试
[root@zabbix local]# /usr/local/logstash/bin/logstash -f /usr/local/logstash/etc/logstash-test.conf
Settings: Default pipeline workers: 2
Logstash startup completed
hello world
{
"message" => "hello world",
"@version" => "1",
"@timestamp" => "2016-03-31T08:20:00.736Z",
"host" => "zabbix.com"
}
2.3安装Elasticsearch
(1)安装Elasticsearch.必须注意不能使用root账户,要使用普通用户本文以appuser用户进行测试。
[root@zabbix software]# tar zxvf elasticsearch-2.2.1.tar.gz -C /usr/local/
[root@zabbix software]#su appuser
[appuser@zabbix local]$ mv elasticsearch-2.2.1/ elasticsearch
[appuser@zabbix local]$  chown -R appuser.appuser /usr/local/elasticsearch/
[appuser@zabbix elasticsearch]$ ./bin/plugin install mobz/elasticsearch-head
-> Installing mobz/elasticsearch-head...
Trying https://github.com/mobz/elasticsearch-head/archive/master.zip ...
Downloading ...........................................................................................................................................................................................................................................................................................................DONE
Verifying https://github.com/mobz/elasticsearch-head/archive/master.zip checksums if available ...
NOTE: Unable to verify checksum for downloaded plugin (unable to find .sha1 or .md5 file to verify)
Installed head into /usr/local/elasticsearch/plugins/head
[appuser@zabbix elasticsearch]$ ls plugins/
head
[appuser@zabbix elasticsearch]$ mkdir /tmp/elasticsearch/data
[appuser@zabbix elasticsearch]$ mkdir /tmp/elasticsearch/logs
[appuser@zabbix elasticsearch]$ ll /tmp/elasticsearch/
total 8
drwxr-xr-x 2 appuser appuser 4096 Mar 31 14:39 data
drwxr-xr-x 2 appuser appuser 4096 Mar 31 14:40 logs
(2)编辑Elasticsearch配置文件
[appuser@zabbix elasticsearch]$  vim config/elasticsearch.yml
cluster.name: cluster-test
node.name: node-1
path.data: /tmp/elasticsearch/data
path.logs: /tmp/elasticsearch/logs
network.host: 192.168.1.245
http.port: 9200
(3)启动Elasticsearch
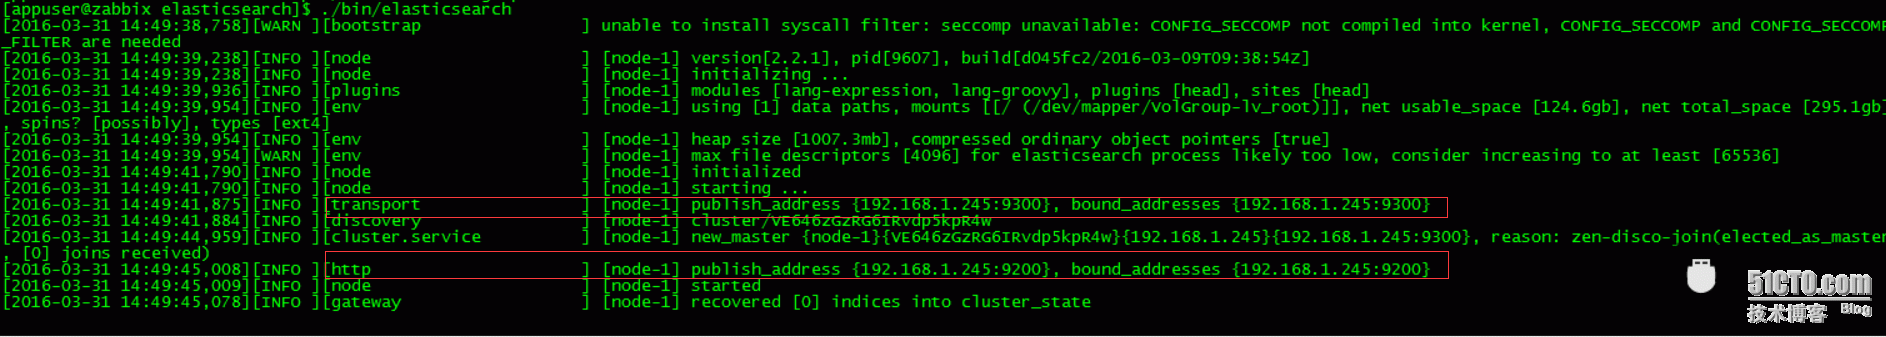
[appuser@zabbix elasticsearch]$ ./bin/elasticsearch &    ## -d或&以后代的方式进行启动
[2016-03-31 14:46:56,648][WARN ][bootstrap                ] unable to install syscall filter: seccomp unavailable: CONFIG_SECCOMP not compiled into kernel, CONFIG_SECCOMP and CONFIG_SECCOMP_FILTER are needed
[2016-03-31 14:46:56,893][INFO ][node                     ] [node-1] version[2.2.1], pid[9530], build[d045fc2/2016-03-09T09:38:54Z]
[2016-03-31 14:46:56,893][INFO ][node                     ] [node-1] initializing ...
[2016-03-31 14:46:57,476][INFO ][plugins                  ] [node-1] modules [lang-expression, lang-groovy], plugins [head], sites [head]
[2016-03-31 14:46:57,495][INFO ][env                      ] [node-1] using [1] data paths, mounts [[/ (/dev/mapper/VolGroup-lv_root)]], net usable_space [124.6gb], net total_space [295.1gb], spins? [possibly], types [ext4]
[2016-03-31 14:46:57,495][INFO ][env                      ] [node-1] heap size [1007.3mb], compressed ordinary object pointers [true]
[2016-03-31 14:46:57,495][WARN ][env                      ] [node-1] max file descriptors [4096] for elasticsearch process likely too low, consider increasing to at least [65536]
[2016-03-31 14:46:59,299][INFO ][node                     ] [node-1] initialized
[2016-03-31 14:46:59,299][INFO ][node                     ] [node-1] starting ...
[2016-03-31 14:46:59,393][INFO ][transport                ] [node-1] publish_address {192.168.1.245:9300}, bound_addresses {192.168.1.245:9300}
[2016-03-31 14:46:59,402][INFO ][discovery                ] [node-1] cluster/X3c1h32aTxqRrc1IHoLWGQ
[2016-03-31 14:47:02,502][INFO ][cluster.service          ] [node-1] new_master {node-1}{X3c1h32aTxqRrc1IHoLWGQ}{192.168.1.245}{192.168.1.245:9300}, reason: zen-disco-join(elected_as_master, [0] joins received)
[2016-03-31 14:47:02,540][INFO ][http                     ] [node-1] publish_address {192.168.1.245:9200}, bound_addresses {192.168.1.245:9200}
[2016-03-31 14:47:02,540][INFO ][node                     ] [node-1] started
[2016-03-31 14:47:02,606][INFO ][gateway                  ] [node-1] recovered [0] indices into cluster_state
出现标红的即为正常,传输端口为9300接受http请求的端口为9200,按ctrl+C停止,加-d或&以后台的方式进行启动Elasticsearch
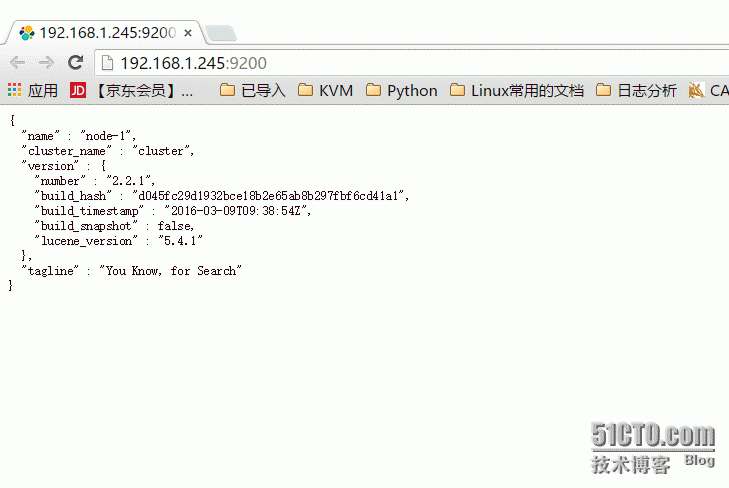
(4)验证启动:验证启动有两种方式:一种通过本机进行访问,另一种通过浏览器进行访问,接下来一一介绍。
方法一:
[appuser@zabbix elasticsearch]$ ps -ef|grep elasticsearch
appuser   9705     1 91 14:55 pts/1    00:00:07 /usr/java/jdk1.8.0_51/bin/java -Xms256m -Xmx1g -Djava.awt.headless=true -XX:+UseParNewGC -XX:+UseConcMarkSweepGC -XX:CMSInitiatingOccupancyFraction=75 -XX:+UseCMSInitiatingOccupancyOnly -XX:+HeapDumpOnOutOfMemoryError -XX:+DisableExplicitGC -Dfile.encoding=UTF-8 -Djna.nosys=true -Des.path.home=/usr/local/elasticsearch -cp /usr/local/elasticsearch/lib/elasticsearch-2.2.1.jar:/usr/local/elasticsearch/lib/* org.elasticsearch.bootstrap.Elasticsearch start -d
appuser   9760  6990  0 14:55 pts/1    00:00:00 grep elasticsearch
[appuser@zabbix elasticsearch]$ netstat -lntp|grep :9200
(Not all processes could be identified, non-owned process info
will not be shown, you would have to be root to see it all.)
tcp        0      0 ::ffff:192.168.1.245:9200   :::*
[appuser@zabbix elasticsearch]$  curl 'http://192.168.1.245:9200/_search?pretty'                                                                                                             {
"took" : 1,
"timed_out" : false,
"_shards" : {
"total" : 0,
"successful" : 0,
"failed" : 0
},
"hits" : {
"total" : 0,
"max_score" : 0.0,
"hits" : [ ]
}
}
方法二:通过浏览器访问:
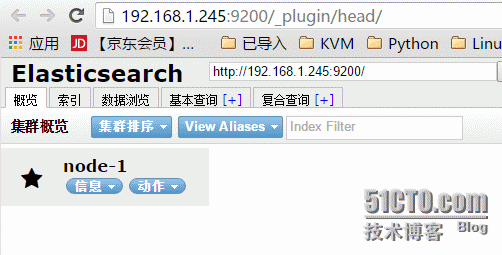
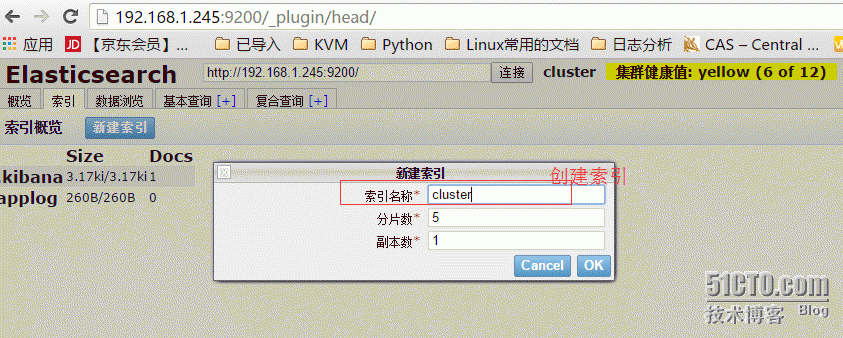
(5)创建Elasticsearch索引
a,由于刚刚安装了head插件,它是一个用浏览器跟Elasticsearch交互的插件,可以查看集群状态,集群的内容,执行搜索和普通 的rest请求等,可以通过:IP:9200/_plugin/head页面进行查看集群状态:
b,点击索引,进行创建
2.4安装Kibana
(1)安装Kibana
[root@zabbix software]# tar zxvf kibana-4.4.2-linux-x64.tar.gz -C /usr/local/
[root@zabbix local]# mv kibana-4.4.2-linux-x64/ kibana
(2)配置kibana
[root@zabbix local]# cd kibana/
[root@zabbix kibana]# vim config/kibana.yml
# Kibana is served by a back end server. This setting specifies the port to use.
server.port: 5601
# This setting specifies the IP address of the back end server.
server.host: "192.168.1.245"
# Enables you to specify a path to mount Kibana at if you are running behind a proxy. This setting
# cannot end in a slash.
# server.basePath: ""
# The maximum payload size in bytes for incoming server requests.
# server.maxPayloadBytes: 1048576
# The URL of the Elasticsearch instance to use for all your queries.
elasticsearch.url: "http://192.168.1.245:9200"
# When this setting’s value is true Kibana uses the hostname specified in the server.host
# setting. When the value of this setting is false, Kibana uses the hostname of the host
# that connects to this Kibana instance.
# elasticsearch.preserveHost: true
# Kibana uses an index in Elasticsearch to store saved searches, visualizations and
# dashboards. Kibana creates a new index if the index doesn’t already exist.
kibana.index: ".kibana"
# The default application to load.
# kibana.defaultAppId: "discover"
把以下注释放开,使配置起作用。
(3)启动Kibana并进行测试访问
[root@zabbix kibana]# ./bin/kibana
log   [15:23:07.861] [info][status][plugin:kibana] Status changed from uninitialized to green - Ready
log   [15:23:07.902] [info][status][plugin:elasticsearch] Status changed from uninitialized to yellow - Waiting for Elasticsearch
log   [15:23:07.919] [info][status][plugin:kbn_vislib_vis_types] Status changed from uninitialized to green - Ready
log   [15:23:07.931] [info][status][plugin:markdown_vis] Status changed from uninitialized to green - Ready
log   [15:23:07.939] [info][status][plugin:metric_vis] Status changed from uninitialized to green - Ready
log   [15:23:07.965] [info][status][plugin:spyModes] Status changed from uninitialized to green - Ready
log   [15:23:07.972] [info][status][plugin:statusPage] Status changed from uninitialized to green - Ready
log   [15:23:07.977] [info][status][plugin:table_vis] Status changed from uninitialized to green - Ready
log   [15:23:07.983] [info][listening] Server running at http://192.168.1.245:5601 log   [15:23:12.980] [info][status][plugin:elasticsearch] Status changed from yellow to yellow - No existing Kibana index found
log   [15:23:16.749] [info][status][plugin:elasticsearch] Status changed from yellow to green - Kibana index ready
查看启动没有报错,可以通过192.168.1.245:5601在浏览器进行访问了。
使用http://kibanaServerIP:5601访问Kibana,登录后,首先,配置一个索引,默认,Kibana的数据被指向Elasticsearch,使用默认的logstash-*的索引名称,并且是基于时间的,点击“Create”即可。
看到如下界面说明索引创建完成
至此ELK平台部署完成。

相关文章推荐
- 小心服务器内存居高不下的元凶--WebAPI服务
- 运维入门
- 利用开源软件打造自己的全功能远程工具
- Linux5.9无人值守安装
- 数据中心和云未来的十二大趋势
- 用vsftp快速搭建ftp服务器
- Linux快速构建apache web服务器
- 服务器监控策略浅谈
- 如何降低服务器采购成本 原理分析
- 建议的服务器分区办法
- 服务器托管六大优势分析
- Erlang实现的一个Web服务器代码实例
- 服务器技术全面解析
- 保护DNS服务器的几点方法小结
- 我国成为全球第二大服务器消费国
- 服务器 安全检查要点[星外提供]
- 服务器应用自动重新启动IIS批处理[原创]_DOS/BAT_脚本之家
- FTP 服务器关于权限的问题
- 批处理设置windows服务器的代码ThecSafe1.9.4第1/3页