matplotlib 可视化 —— 移动坐标轴(中心位置)
2018-11-14 02:11
92 查看
分享一下我老师大神的人工智能教程!零基础,通俗易懂!http://blog.csdn.net/jiangjunshow
也欢迎大家转载本篇文章。分享知识,造福人民,实现我们中华民族伟大复兴!
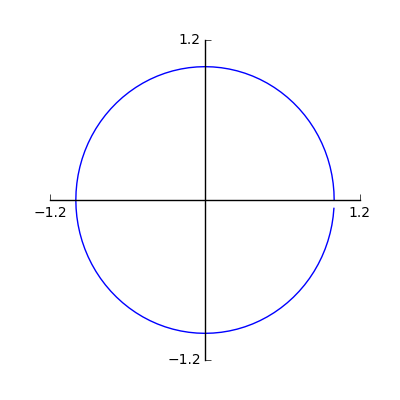
通常软件绘图,包括 matlab、python 的 matplotlib,默认都是将坐标轴置于画布(figure)的最下侧(x 轴),最左侧(y 轴),也即将坐标原点置于左下角。而我们自己理解数学,以及手动绘图时,都会将坐标轴置于中心的位置。
1. 导入相关的包
import numpy as npimport matplotlib.pyplot as plt
- 1
- 2
2. 获取 figure 和 axis
fig = plt.figure(figsize=(4, 4))ax = fig.add_subplot(111)plt.show()
- 1
- 2
- 3
- 4
- 5
3. 隐藏上边和右边
上下左右,四个边属于当前轴对象(axis);
ax.spines['top'].set_color('none')ax.spines['right'].set_color('none')- 1
- 2
4. 移动另外两个轴
ax.xaxis.set_ticks_position('bottom')ax.spines['bottom'].set_position(('data', 0))ax.yaxis.set_ticks_position('left')ax.spines['left'].set_position(('data', 0))- 1
- 2
- 3
- 4
5. 填充数据
theta = np.arange(0, 2*np.pi, 2*np.pi/100)ax.plot(np.cos(theta), np.sin(theta))plt.show()
- 1
- 2
- 3
7. 其他设置
plt.style.use('ggplot')ax.set_xticks([-1.2, 1.2])ax.set_yticks([-1.2, 1.2])- 1
- 2
- 3
完整代码:
import numpy as npimport matplotlib.pyplot as pltfig = plt.figure(figsize=(4, 4))ax = fig.add_subplot(111)ax.spines['top'].set_color('none')ax.spines['right'].set_color('none')ax.xaxis.set_ticks_position('bottom')ax.spines['bottom'].set_position(('data', 0))ax.yaxis.set_ticks_position('left')ax.spines['left'].set_position(('data', 0))theta = np.arange(0, 2*np.pi, 2*np.pi/100)ax.plot(np.cos(theta), np.sin(theta))plt.style.use('ggplot')ax.set_xticks([-1.2, 1.2])ax.set_yticks([-1.2, 1.2])plt.show()- 1
- 2
- 3
- 4
- 5
- 6
- 7
- 8
- 9
- 10
- 11
- 12
- 13
- 14
- 15
- 16
- 17
- 18
- 19
- 20
- 21
- 22
给我老师的人工智能教程打call!http://blog.csdn.net/jiangjunshow
 阅读更多
阅读更多

相关文章推荐
- matplotlib 可视化 —— 移动坐标轴(中心位置)
- matplotlib 可视化 —— 移动坐标轴(中心位置)
- matplotlib模块数据可视化-修改坐标轴位置
- Python 使用matplotlib画图添加标注、及移动坐标轴位置
- Python 使用matplotlib画图添加标注、及移动坐标轴位置
- matplotlib 显示图片鼠标所指位置的坐标
- matplotlib模块数据可视化-设置坐标轴
- Python使用matplotlib进行可视化时精确控制图例位置
- matplotlib模块数据可视化-设置次坐标轴
- Python数据可视化图像库MatPlotLib基本图像操作
- [置顶] matplotlib 绘图可视化知识点整理
- Python利用matplotlib做图中图及次坐标轴
- 如何在matplotlib中两个坐标轴之间画一条直线光标
- Matplotlib学习笔记之数据可视化
- matplotlib中文坐标轴和标题显示
- matplotlib模块数据可视化-设置tick的能见度
- python 数据可视化 matplotlib学习一:绘制简单的折线图
- 使用matplotlib的示例:调整字体-设置刻度、坐标、colormap和colorbar等
- Python--matplotlib绘图可视化知识点整理
- matplotlib画图坐标轴设置