python3+PyQt5实现柱状图
2018-04-24 09:25
691 查看
本文通过Python3+pyqt5实现了python Qt GUI 快速编程的16章的excise例子。
#!/usr/bin/env python3
import random
import sys
from PyQt5.QtCore import (QAbstractListModel, QAbstractTableModel,
QModelIndex, QSize, QTimer, QVariant, Qt,pyqtSignal)
from PyQt5.QtWidgets import (QApplication, QDialog, QHBoxLayout,
QListView, QSpinBox, QStyledItemDelegate,QStyleOptionViewItem, QWidget)
from PyQt5.QtGui import QColor,QPainter,QPixmap
class BarGraphModel(QAbstractListModel):
dataChanged=pyqtSignal(QModelIndex,QModelIndex)
def __init__(self):
super(BarGraphModel, self).__init__()
self.__data = []
self.__colors = {}
self.minValue = 0
self.maxValue = 0
def rowCount(self, index=QModelIndex()):
return len(self.__data)
def insertRows(self, row, count):
extra = row + count
if extra >= len(self.__data):
self.beginInsertRows(QModelIndex(), row, row + count - 1)
self.__data.extend([0] * (extra - len(self.__data) + 1))
self.endInsertRows()
return True
return False
def flags(self, index):
#return (QAbstractTableModel.flags(self, index)|Qt.ItemIsEditable)
return (QAbstractListModel.flags(self, index)|Qt.ItemIsEditable)
def setData(self, index, value, role=Qt.DisplayRole):
row = index.row()
if not index.isValid() or 0 > row >= len(self.__data):
return False
changed = False
if role == Qt.DisplayRole:
value = value
self.__data[row] = value
if self.minValue > value:
self.minValue = value
if self.maxValue < value:
self.maxValue = value
changed = True
elif role == Qt.UserRole:
self.__colors[row] = value
#self.emit(SIGNAL("dataChanged(QModelIndex,QModelIndex)"),
#   index, index)
self.dataChanged[QModelIndex,QModelIndex].emit(index, index)
changed = True
if changed:
#self.emit(SIGNAL("dataChanged(QModelIndex,QModelIndex)"),
#   index, index)
self.dataChanged[QModelIndex,QModelIndex].emit(index, index)
return changed
def data(self, index, role=Qt.DisplayRole):
row = index.row()
if not index.isValid() or 0 > row >= len(self.__data):
return QVariant()
if role == Qt.DisplayRole:
return self.__data[row]
if role == Qt.UserRole:
return QVariant(self.__colors.get(row,
QColor(Qt.red)))
if role == Qt.DecorationRole:
color = QColor(self.__colors.get(row,
QColor(Qt.red)))
pixmap = QPixmap(20, 20)
pixmap.fill(color)
return QVariant(pixmap)
return QVariant()
class BarGraphDelegate(QStyledItemDelegate):
def __init__(self, minimum=0, maximum=100, parent=None):
super(BarGraphDelegate, self).__init__(parent)
self.minimum = minimum
self.maximum = maximum
def paint(self, painter, option, index):
myoption = QStyleOptionViewItem(option)
myoption.displayAlignment |= (Qt.AlignRight|Qt.AlignVCenter)
QStyledItemDelegate.paint(self, painter, myoption, index)
def createEditor(self, parent, option, index):
spinbox = QSpinBox(parent)
spinbox.setRange(self.minimum, self.maximum)
spinbox.setAlignment(Qt.AlignRight|Qt.AlignVCenter)
return spinbox
def setEditorData(self, editor, index):
value = index.model().data(index, Qt.DisplayRole)
editor.setValue(value)
def setModelData(self, editor, model, index):
editor.interpretText()
model.setData(index, editor.value())
class BarGraphView(QWidget):
WIDTH = 20
def __init__(self, parent=None):
super(BarGraphView, self).__init__(parent)
self.model = None
def setModel(self, model):
self.model = model
#self.connect(self.model,
#  SIGNAL("dataChanged(QModelIndex,QModelIndex)"),
#  self.update)
self.model.dataChanged[QModelIndex,QModelIndex].connect(self.update)
#self.connect(self.model, SIGNAL("modelReset()"), self.update)
self.model.modelReset.connect(self.update)
def sizeHint(self):
return self.minimumSizeHint()
def minimumSizeHint(self):
if self.model is None:
return QSize(BarGraphView.WIDTH * 10, 100)
return QSize(BarGraphView.WIDTH * self.model.rowCount(), 100)
def paintEvent(self, event):
if self.model is None:
return
painter = QPainter(self)
painter.setRenderHint(QPainter.Antialiasing)
span = self.model.maxValue - self.model.minValue
painter.setWindow(0, 0, BarGraphView.WIDTH * self.model.rowCount(),
span)
for row in range(self.model.rowCount()):
x = row * BarGraphView.WIDTH
index = self.model.index(row)
color = QColor(self.model.data(index, Qt.UserRole))
y = self.model.data(index)
painter.fillRect(x, span - y, BarGraphView.WIDTH, y, color)
class MainForm(QDialog):
def __init__(self, parent=None):
super(MainForm, self).__init__(parent)
self.model = BarGraphModel()
self.barGraphView = BarGraphView()
self.barGraphView.setModel(self.model)
self.listView = QListView()
self.listView.setModel(self.model)
self.listView.setItemDelegate(BarGraphDelegate(0, 1000, self))
self.listView.setMaximumWidth(100)
self.listView.setEditTriggers(QListView.DoubleClicked|
QListView.EditKeyPressed)
layout = QHBoxLayout()
layout.addWidget(self.listView)
layout.addWidget(self.barGraphView, 1)
self.setLayout(layout)
self.setWindowTitle("Bar Grapher")
QTimer.singleShot(0, self.initialLoad)
def initialLoad(self):
# Generate fake data
count = 20
self.model.insertRows(0, count - 1)
for row in range(count):
value = random.randint(1, 150)
color = QColor(random.randint(0, 255), random.randint(0, 255),
random.randint(0, 255))
index = self.model.index(row)
self.model.setData(index, value)
self.model.setData(index, QVariant(color), Qt.UserRole)
app = QApplication(sys.argv)
form = MainForm()
form.resize(600, 400)
form.show()
app.exec_()
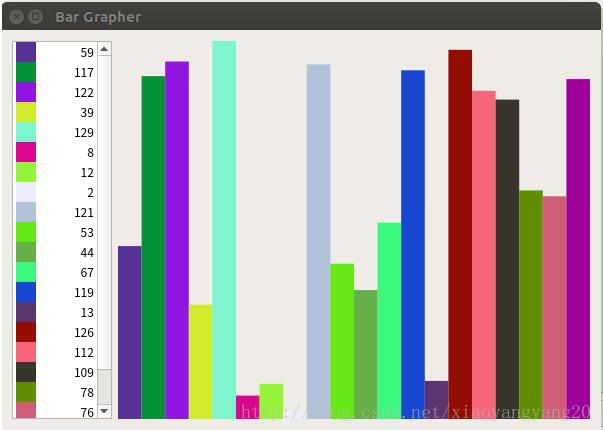
运行结果:
以上就是本文的全部内容,希望对大家的学习有所帮助,也希望大家多多支持脚本之家。
您可能感兴趣的文章:
- python使用matplotlib绘制柱状图教程
- python+matplotlib实现礼盒柱状图实例代码
- Python实现绘制双柱状图并显示数值功能示例
- Python+matplotlib+numpy绘制精美的条形统计图
- Python基于Matplotlib库简单绘制折线图的方法示例
- python利用matplotlib库绘制饼图的方法示例
- Python使用matplotlib实现基础绘图功能示例
- Python使用matplotlib和pandas实现的画图操作【经典示例】
- Python实现正弦信号的时域波形和频谱图示例【基于matplotlib】
- Python画柱状统计图操作示例【基于matplotlib库】

相关文章推荐
- Python实现绘制双柱状图并显示数值功能示例
- python3+PyQt5实现拖放
- 一个基于python3+PyQt5实现的简单计算器程序
- ubuntu下搭建python2.7+PyQt5并实现一个小词典
- python3+PyQt5实现支持多线程的页面索引器应用程序
- python3+PyQt5实现自定义分数滑块部件
- Linux python PyQt5调用百度API实现图片文字转换
- python3+PyQt5实现窗口切分条
- python3+PyQt5重新实现自定义数据拖放处理
- python3+PyQt5重新实现QT事件处理程序
- python3+PyQt5实现自定义窗口部件Counters
- Python PyQt5实现的简易计算器功能示例
- 完美配置Python3.5+Anaconda+PyQt5,实现UI和其他模块的结合
- 利用Python和PyQt5实现简易浏览器
- python+matplotlib实现礼盒柱状图实例代码
- python3+PyQt5实现拖放功能
- python3+PyQt5实现使用剪贴板做复制与粘帖示例
- python3+PyQt5图形项的自定义和交互 python3实现page Designer应用程序
- python3+PyQt5实现文档打印功能
- python3+PyQt5实现自定义流体混合窗口部件