利用python深度分析微信朋友圈好友
2018-03-22 00:44
1051 查看
最近看了wxpy这个包,感觉还不错,分析一下微信的好友。
分析的目的:
1.看看好友的性别占比、地域分布
2.分析好友的个性签名
3.对好友的签名进行情感分析
环境:python 3.6
需要的包wxpy、jieba、snownlp、scipy、wordcloud(这个pip可能直接安装不了,会提示需要c++之类的错误,直接去官网下载whl文件,用pip离线安装就好了,命令:pip install D:/xxxx/xxxx/xxx.whl把xxx换成你的文件路径)
过程如下:
先导入需要的所有包。利用wxpy的bot()接口,可以获得好友、公众号、群聊等属性,可以完成大部分web端微信的操作,比如自己跟自己聊天,添加好友等。from wxpy import *
from snownlp import SnowNLP,sentiment
import re,jieba
from scipy.misc import imread
from wordcloud import WordCloud, ImageColorGenerator,STOPWORDS
import matplotlib.pyplot as plt
from collections import Counter
bot=Bot()
friends=bot.friends()#获得好友对象
groups=bot.groups()#获得群聊对象
mps=bot.mps()#获得微信公众号
print(mps)
#计算男女性别,画出饼图
sex_dict={'boy':0,'girl':0,'other':0}
for friend in friends:
if friend.sex==1:
sex_dict['boy']+=1
elif friend.sex==2:
sex_dict['girl']+=1
else:
sex_dict['other']+=1
print('有男生{}个,女生{}个,未知性别{}个'.format(sex_dict['boy'],sex_dict['girl'],sex_dict['other']))
labels = ['boy','girl','other']
colors = ['red','yellow','green']
explode = (0.1, 0, 0) #最大的突出显示
plt.figure(figsize=(8,5), dpi=80)
plt.axes(aspect=1)
plt.pie(sex_dict.values(),explode=explode,labels=labels, autopct='%1.2f%%',colors=colors,labeldistance = 1.1, shadow = True, startangle = 90, pctdistance = 0.6)
plt.title("SEX ANALYSIS",bbox=dict(facecolor='g', edgecolor='blue', alpha=0.65 ))#设置标题和标题边框
plt.savefig("sex_analysis.jpg")
plt.show()
运行过程中,会弹出二维码,微信扫描登录一下就可以看到下面的图片了。
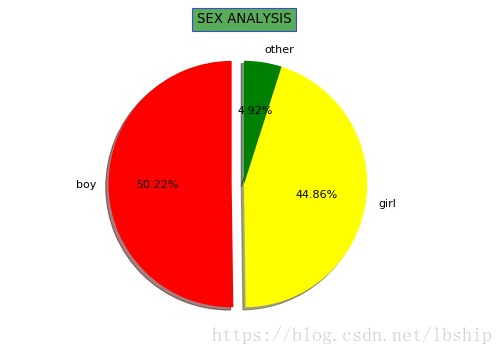
我的好友男女平均分配,不知道其他人的怎么样。
接下来看好友的地域分布city=[]
Municipality=['上海','上海市','北京','北京市','重庆','重庆市','天津','天津市']
for friend in friends:
if friend.province in Municipality:
city.append(friend.province)#直辖市直接添加城市
else:
city.append(friend.city)
#print(city.count('上海'))
counts=dict(Counter(city))#统计各个地区人数
print(counts)
df=pd.DataFrame([counts]).T#转成DataFrame方便保存和后面画图,装置成竖排形式
df.to_excel('city.xlsx')看地理图,就要请出大名鼎鼎的tableau,一键生成,用matplotlib也可以画地理图,比较麻烦一些而已。
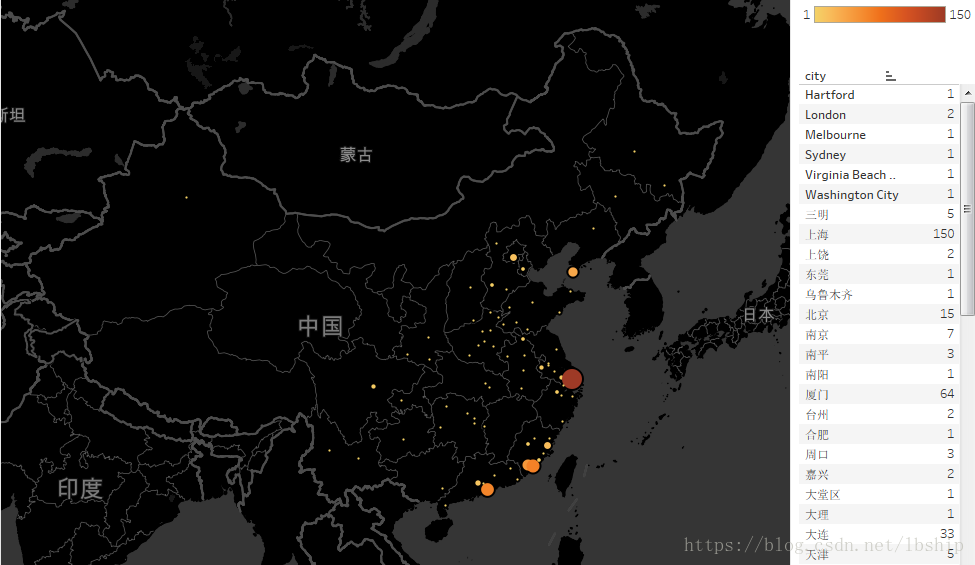
地理图可以很清晰看到好友分布地域和数量。
接下来进行好友签名分析和情感分析
text1=[]
emotions=[]
for friend in friends:
sig=friend.signature.strip()
newsig=re.sub(re.compile('<.*?>|[0-9]|。|,|!|~|—|”|“|《|》|\?|、|:'), '', sig)#去掉数字标点符号
text1.append(newsig)
if len(newsig)>0:
sentiments = SnowNLP(newsig).sentiments
emotions.append(sentiments)
text = "".join(text1)
wordlist=" ".join(jieba.cut(text,cut_all=True))#结巴分词,用空格连接
stopwords = STOPWORDS#设置停用词
bgimg=imread(r'C:\Users\lbship\Desktop\mice.jpg')#设置背景图片
font_path=r'C:\Windows\Fonts\simkai.ttf'
wc = WordCloud(font_path=font_path, # 设置字体
background_color="white", # 背景颜色
max_words=2000, # 词云显示的最大词数
stopwords = stopwords, # 设置停用词
mask=bgimg, # 设置背景图片
max_font_size=100, # 字体最大值
random_state=42,#设置有多少种随机生成状态,即有多少种配色
widt
4000
h=1000, height=860, margin=2,# 设置图片默认的大小,margin为词语边缘距离
).generate(wordlist)
image_colors = ImageColorGenerator(bgimg)#根据图片生成词云颜色
plt.imshow(wc)
plt.axis("off")#不显示坐标尺寸
plt.savefig("sig.jpg")
plt.show()
#情感分析
positive=len(list(i for i in emotions if i>0.66))
normal=len(list(i for i in emotions if i<=0.66 and i>=0.33))
#normal = len(list(filter(lambda x:x>=0.33 and x<=0.66,emotions)))
negative=len(list(i for i in emotions if i<0.33))
labels = ['POSITIVE','NORMAL','NEGATIVE']
values = (positive,normal,negative)
plt.rcParams['font.sans-serif'] = ['simHei']
plt.rcParams['axes.unicode_minus'] = False
plt.title("SENTIMENTS ANALYSIS",fontsize='large',fontweight='bold',bbox=dict(facecolor='blue', edgecolor='yellow', alpha=0.5 ))
plt.xlabel('sentiments analysis')
plt.ylabel('counts')
plt.xticks(range(3),labels)
plt.bar(range(3), values, color = 'rgb')
plt.savefig("sentiment.jpg")
plt.show()
分析的结果如下。
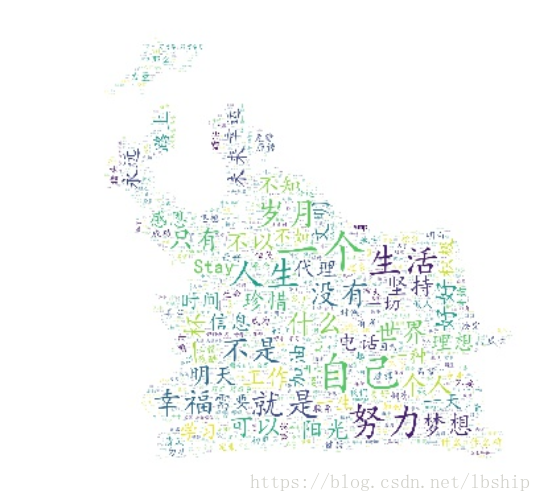
嗯,都是有梦想会努力会坚持会珍惜会幸福会生活懂人生的小伙伴。
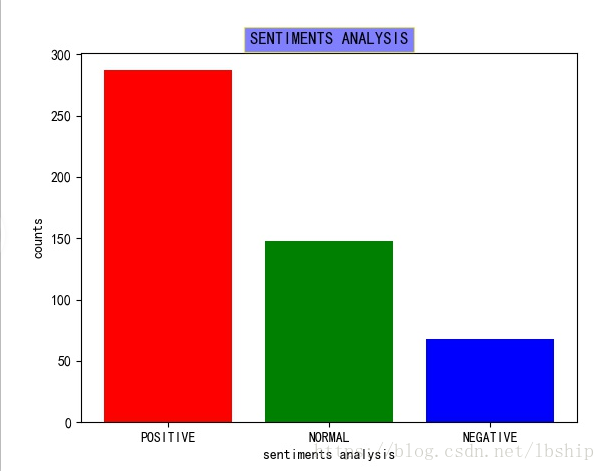
朋友圈还是积极向上的朋友比较多。
下面是完整代码:from wxpy import *
from snownlp import SnowNLP,sentiment
import re,jieba
import pandas as pd
from scipy.misc import imread
from wordcloud import WordCloud, ImageColorGenerator,STOPWORDS
import matplotlib.pyplot as plt
from collections import Counter
bot=Bot()
friends=bot.friends()#获得好友对象
groups=bot.groups()#获得群聊对象
mps=bot.mps()#获得微信公众号
print(mps)
#计算男女性别,画出饼图
sex_dict={'boy':0,'girl':0,'other':0}
for friend in friends:
if friend.sex==1:
sex_dict['boy']+=1
elif friend.sex==2:
sex_dict['girl']+=1
else:
sex_dict['other']+=1
print('有男生{}个,女生{}个,未知性别{}个'.format(sex_dict['boy'],sex_dict['girl'],sex_dict['other']))
labels = ['boy','girl','other']
colors = ['red','yellow','green']
explode = (0.1, 0, 0) #最大的突出显示
plt.figure(figsize=(8,5), dpi=80)
plt.axes(aspect=1)
plt.pie(sex_dict.values(),explode=explode,labels=labels, autopct='%1.2f%%',colors=colors,labeldistance = 1.1, shadow = True, startangle = 90, pctdistance = 0.6)
plt.title("SEX ANALYSIS",bbox=dict(facecolor='g', edgecolor='blue', alpha=0.65 ))#设置标题和标题边框
plt.savefig("sex_analysis.jpg")
plt.show()
#获取城市分布
city=[]
Municipality=['上海','上海市','北京','北京市','重庆','重庆市','天津','天津市']
for friend in friends:
if friend.province in Municipality:
city.append(friend.province)#直辖市直接添加城市
else:
city.append(friend.city)
#print(city.count('上海'))
counts=dict(Counter(city))#统计各个地区人数
print(counts)
df=pd.DataFrame([counts]).T#转成DataFrame方便保存和后面画图,装置成竖排形式
df.to_excel('city.xlsx')
#获取好友签名,生成词云,并进行情感分析
text1=[]
emotions=[]
for friend in friends:
sig=friend.signature.strip()
newsig=re.sub(re.compile('<.*?>|[0-9]|。|,|!|~|—|”|“|《|》|\?|、|:'), '', sig)#去掉数字标点符号
text1.append(newsig)
if len(newsig)>0:
sentiments = SnowNLP(newsig).sentiments
emotions.append(sentiments)
text = "".join(text1)
wordlist=" ".join(jieba.cut(text,cut_all=True))#结巴分词,用空格连接
stopwords = STOPWORDS#设置停用词
bgimg=imread(r'C:\Users\lbship\Desktop\mice.jpg')#设置背景图片
font_path=r'C:\Windows\Fonts\simkai.ttf'
wc = WordCloud(font_path=font_path, # 设置字体
background_color="white", # 背景颜色
max_words=2000, # 词云显示的最大词数
stopwords = stopwords, # 设置停用词
mask=bgimg, # 设置背景图片
max_font_size=100, # 字体最大值
random_state=42,#设置有多少种随机生成状态,即有多少种配色
width=1000, height=860, margin=2,# 设置图片默认的大小,margin为词语边缘距离
).generate(wordlist)
image_colors = ImageColorGenerator(bgimg)#根据图片生成词云颜色
plt.imshow(wc)
plt.axis("off")#不显示坐标尺寸
plt.savefig("sig.jpg")
plt.show()
#情感分析
positive=len(list(i for i in emotions if i>0.66))
normal=len(list(i for i in emotions if i<=0.66 and i>=0.33))
#normal = len(list(filter(lambda x:x>=0.33 and x<=0.66,emotions)))
negative=len(list(i for i in emotions if i<0.33))
labels = ['POSITIVE','NORMAL','NEGATIVE']
values = (positive,normal,negative)
plt.rcParams['font.sans-serif'] = ['simHei']
plt.rcParams['axes.unicode_minus'] = False
plt.title("SENTIMENTS ANALYSIS",fontsize='large',fontweight='bold',bbox=dict(facecolor='blue', edgecolor='yellow', alpha=0.5 ))
plt.xlabel('sentiments analysis')
plt.ylabel('counts')
plt.xticks(range(3),labels)
plt.bar(range(3), values, color = 'rgb')
plt.savefig("sentiment.jpg")
plt.show()
分析的目的:
1.看看好友的性别占比、地域分布
2.分析好友的个性签名
3.对好友的签名进行情感分析
环境:python 3.6
需要的包wxpy、jieba、snownlp、scipy、wordcloud(这个pip可能直接安装不了,会提示需要c++之类的错误,直接去官网下载whl文件,用pip离线安装就好了,命令:pip install D:/xxxx/xxxx/xxx.whl把xxx换成你的文件路径)
过程如下:
先导入需要的所有包。利用wxpy的bot()接口,可以获得好友、公众号、群聊等属性,可以完成大部分web端微信的操作,比如自己跟自己聊天,添加好友等。from wxpy import *
from snownlp import SnowNLP,sentiment
import re,jieba
from scipy.misc import imread
from wordcloud import WordCloud, ImageColorGenerator,STOPWORDS
import matplotlib.pyplot as plt
from collections import Counter
bot=Bot()
friends=bot.friends()#获得好友对象
groups=bot.groups()#获得群聊对象
mps=bot.mps()#获得微信公众号
print(mps)
#计算男女性别,画出饼图
sex_dict={'boy':0,'girl':0,'other':0}
for friend in friends:
if friend.sex==1:
sex_dict['boy']+=1
elif friend.sex==2:
sex_dict['girl']+=1
else:
sex_dict['other']+=1
print('有男生{}个,女生{}个,未知性别{}个'.format(sex_dict['boy'],sex_dict['girl'],sex_dict['other']))
labels = ['boy','girl','other']
colors = ['red','yellow','green']
explode = (0.1, 0, 0) #最大的突出显示
plt.figure(figsize=(8,5), dpi=80)
plt.axes(aspect=1)
plt.pie(sex_dict.values(),explode=explode,labels=labels, autopct='%1.2f%%',colors=colors,labeldistance = 1.1, shadow = True, startangle = 90, pctdistance = 0.6)
plt.title("SEX ANALYSIS",bbox=dict(facecolor='g', edgecolor='blue', alpha=0.65 ))#设置标题和标题边框
plt.savefig("sex_analysis.jpg")
plt.show()
运行过程中,会弹出二维码,微信扫描登录一下就可以看到下面的图片了。
我的好友男女平均分配,不知道其他人的怎么样。
接下来看好友的地域分布city=[]
Municipality=['上海','上海市','北京','北京市','重庆','重庆市','天津','天津市']
for friend in friends:
if friend.province in Municipality:
city.append(friend.province)#直辖市直接添加城市
else:
city.append(friend.city)
#print(city.count('上海'))
counts=dict(Counter(city))#统计各个地区人数
print(counts)
df=pd.DataFrame([counts]).T#转成DataFrame方便保存和后面画图,装置成竖排形式
df.to_excel('city.xlsx')看地理图,就要请出大名鼎鼎的tableau,一键生成,用matplotlib也可以画地理图,比较麻烦一些而已。
地理图可以很清晰看到好友分布地域和数量。
接下来进行好友签名分析和情感分析
text1=[]
emotions=[]
for friend in friends:
sig=friend.signature.strip()
newsig=re.sub(re.compile('<.*?>|[0-9]|。|,|!|~|—|”|“|《|》|\?|、|:'), '', sig)#去掉数字标点符号
text1.append(newsig)
if len(newsig)>0:
sentiments = SnowNLP(newsig).sentiments
emotions.append(sentiments)
text = "".join(text1)
wordlist=" ".join(jieba.cut(text,cut_all=True))#结巴分词,用空格连接
stopwords = STOPWORDS#设置停用词
bgimg=imread(r'C:\Users\lbship\Desktop\mice.jpg')#设置背景图片
font_path=r'C:\Windows\Fonts\simkai.ttf'
wc = WordCloud(font_path=font_path, # 设置字体
background_color="white", # 背景颜色
max_words=2000, # 词云显示的最大词数
stopwords = stopwords, # 设置停用词
mask=bgimg, # 设置背景图片
max_font_size=100, # 字体最大值
random_state=42,#设置有多少种随机生成状态,即有多少种配色
widt
4000
h=1000, height=860, margin=2,# 设置图片默认的大小,margin为词语边缘距离
).generate(wordlist)
image_colors = ImageColorGenerator(bgimg)#根据图片生成词云颜色
plt.imshow(wc)
plt.axis("off")#不显示坐标尺寸
plt.savefig("sig.jpg")
plt.show()
#情感分析
positive=len(list(i for i in emotions if i>0.66))
normal=len(list(i for i in emotions if i<=0.66 and i>=0.33))
#normal = len(list(filter(lambda x:x>=0.33 and x<=0.66,emotions)))
negative=len(list(i for i in emotions if i<0.33))
labels = ['POSITIVE','NORMAL','NEGATIVE']
values = (positive,normal,negative)
plt.rcParams['font.sans-serif'] = ['simHei']
plt.rcParams['axes.unicode_minus'] = False
plt.title("SENTIMENTS ANALYSIS",fontsize='large',fontweight='bold',bbox=dict(facecolor='blue', edgecolor='yellow', alpha=0.5 ))
plt.xlabel('sentiments analysis')
plt.ylabel('counts')
plt.xticks(range(3),labels)
plt.bar(range(3), values, color = 'rgb')
plt.savefig("sentiment.jpg")
plt.show()
分析的结果如下。
嗯,都是有梦想会努力会坚持会珍惜会幸福会生活懂人生的小伙伴。
朋友圈还是积极向上的朋友比较多。
下面是完整代码:from wxpy import *
from snownlp import SnowNLP,sentiment
import re,jieba
import pandas as pd
from scipy.misc import imread
from wordcloud import WordCloud, ImageColorGenerator,STOPWORDS
import matplotlib.pyplot as plt
from collections import Counter
bot=Bot()
friends=bot.friends()#获得好友对象
groups=bot.groups()#获得群聊对象
mps=bot.mps()#获得微信公众号
print(mps)
#计算男女性别,画出饼图
sex_dict={'boy':0,'girl':0,'other':0}
for friend in friends:
if friend.sex==1:
sex_dict['boy']+=1
elif friend.sex==2:
sex_dict['girl']+=1
else:
sex_dict['other']+=1
print('有男生{}个,女生{}个,未知性别{}个'.format(sex_dict['boy'],sex_dict['girl'],sex_dict['other']))
labels = ['boy','girl','other']
colors = ['red','yellow','green']
explode = (0.1, 0, 0) #最大的突出显示
plt.figure(figsize=(8,5), dpi=80)
plt.axes(aspect=1)
plt.pie(sex_dict.values(),explode=explode,labels=labels, autopct='%1.2f%%',colors=colors,labeldistance = 1.1, shadow = True, startangle = 90, pctdistance = 0.6)
plt.title("SEX ANALYSIS",bbox=dict(facecolor='g', edgecolor='blue', alpha=0.65 ))#设置标题和标题边框
plt.savefig("sex_analysis.jpg")
plt.show()
#获取城市分布
city=[]
Municipality=['上海','上海市','北京','北京市','重庆','重庆市','天津','天津市']
for friend in friends:
if friend.province in Municipality:
city.append(friend.province)#直辖市直接添加城市
else:
city.append(friend.city)
#print(city.count('上海'))
counts=dict(Counter(city))#统计各个地区人数
print(counts)
df=pd.DataFrame([counts]).T#转成DataFrame方便保存和后面画图,装置成竖排形式
df.to_excel('city.xlsx')
#获取好友签名,生成词云,并进行情感分析
text1=[]
emotions=[]
for friend in friends:
sig=friend.signature.strip()
newsig=re.sub(re.compile('<.*?>|[0-9]|。|,|!|~|—|”|“|《|》|\?|、|:'), '', sig)#去掉数字标点符号
text1.append(newsig)
if len(newsig)>0:
sentiments = SnowNLP(newsig).sentiments
emotions.append(sentiments)
text = "".join(text1)
wordlist=" ".join(jieba.cut(text,cut_all=True))#结巴分词,用空格连接
stopwords = STOPWORDS#设置停用词
bgimg=imread(r'C:\Users\lbship\Desktop\mice.jpg')#设置背景图片
font_path=r'C:\Windows\Fonts\simkai.ttf'
wc = WordCloud(font_path=font_path, # 设置字体
background_color="white", # 背景颜色
max_words=2000, # 词云显示的最大词数
stopwords = stopwords, # 设置停用词
mask=bgimg, # 设置背景图片
max_font_size=100, # 字体最大值
random_state=42,#设置有多少种随机生成状态,即有多少种配色
width=1000, height=860, margin=2,# 设置图片默认的大小,margin为词语边缘距离
).generate(wordlist)
image_colors = ImageColorGenerator(bgimg)#根据图片生成词云颜色
plt.imshow(wc)
plt.axis("off")#不显示坐标尺寸
plt.savefig("sig.jpg")
plt.show()
#情感分析
positive=len(list(i for i in emotions if i>0.66))
normal=len(list(i for i in emotions if i<=0.66 and i>=0.33))
#normal = len(list(filter(lambda x:x>=0.33 and x<=0.66,emotions)))
negative=len(list(i for i in emotions if i<0.33))
labels = ['POSITIVE','NORMAL','NEGATIVE']
values = (positive,normal,negative)
plt.rcParams['font.sans-serif'] = ['simHei']
plt.rcParams['axes.unicode_minus'] = False
plt.title("SENTIMENTS ANALYSIS",fontsize='large',fontweight='bold',bbox=dict(facecolor='blue', edgecolor='yellow', alpha=0.5 ))
plt.xlabel('sentiments analysis')
plt.ylabel('counts')
plt.xticks(range(3),labels)
plt.bar(range(3), values, color = 'rgb')
plt.savefig("sentiment.jpg")
plt.show()

相关文章推荐
- Python利用itchat对微信中好友数据实现简单分析的方法
- 利用python进行微信好友分析
- 利用 Python 分析微信好友性别和位置
- 利用python进行微信好友数据分析
- 利用 Python 分析微信好友性别和位置
- 使用Python对微信好友进行数据分析
- 用python 分析微信好友信息并生成词云
- python数据分析(1)——获取微信好友的统计信息
- 基于Python实现的微信好友数据分析
- Python微信好友信息意义及取值分析(基于itchat)
- 从安卓手机ROOT提取微信聊天记录到利用Python进行词云分析全过程
- 利用python爬取天气预报然后发送给微信好友
- 基于Python实现的微信好友数据分析
- 基于Python实现的微信好友数据分析
- Python实现的微信好友数据分析功能示例
- 基于Python实现的微信好友数据分析
- Python对微信好友进行简单统计分析
- 基于Python实现的微信好友数据分析
- [置顶] Python 使用itchat 对微信好友数据进行简单分析
- 利用Python网络爬虫抓取微信好友的签名及其可视化展示