Python数据分析与机器学习-使用sklearn构造决策树模型
2018-01-03 15:31
956 查看
# datasets包括内置的数据集 california_housing房价的数据集
from sklearn.datasets.california_housing import fetch_california_housing
import pandas as pd
housing = fetch_california_housing()
# print(housing.DESCR)
# print(housing.data)
# print(housing.data.shape) #(20640, 8)
# print(housing.target)
# print(housing.feature_names)
# #['MedInc', 'HouseAge', 'AveRooms', 'AveBedrms', 'Population', 'AveOccup', 'Latitude', 'Longitude']
from sklearn import tree
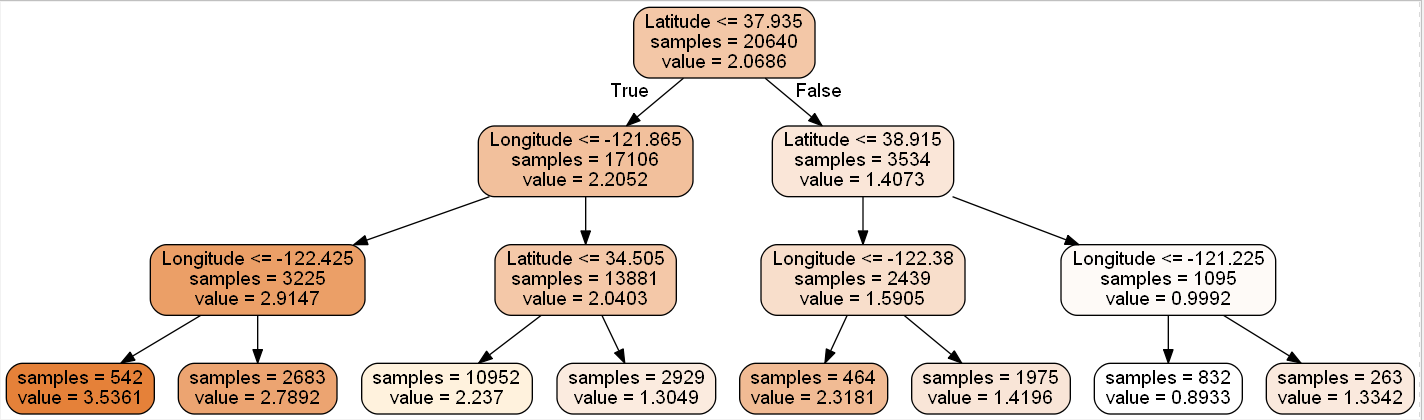
dtr = tree.DecisionTreeRegressor(max_depth=2) # DecisionTreeRegressor 决策树 max_depth 树的最大深度
dtr.fit(housing.data[:, [6, 7]], housing.target) # latitude longitude 纬度经度 传入:X y
# print(dtr)
'''
DecisionTreeRegressor(criterion='mse', max_depth=2, max_features=None,
max_leaf_nodes=None, min_samples_leaf=1, min_samples_split=2,
min_weight_fraction_leaf=0.0, presort=False, random_state=None,
splitter='best')
'''
'''决策树模型可视化'''
dot_data = \
tree.export_graphviz(
dtr, # 构造矩阵名字
out_file="tree.dot",
feature_names=housing.feature_names[6:8], # 特征名字
filled=True,
impurity=False,
rounded=True
)
import pydotplus
from IPython.display import Image
graph = pydotplus.graph_from_dot_file("tree.dot")
graph.get_nodes()[7].set_fillcolor("#FFF2DD")
Image(graph.create_png())
graph.write_png("dtr_white_background.png") # 保存为本地图片
from sklearn.cross_validation import train_test_split
X_train, X_test, y_train, y_test = train_test_split(housing.data[0:1000], housing.target[0:1000], test_size=0.1,
random_state=42) # random_state = 42 值随意,保证每次随机完结果一样
dtr = tree.DecisionTreeRegressor(random_state=42)
dtr.fit(X_train, y_train)
print(dtr.score(X_test, y_test))
'''随机森林'''
from sklearn.grid_search import GridSearchCV # GridSearchCV 自动设置参数组合
from sklearn.ensemble import RandomForestRegressor
tree_param_grid = {"min_samples_split": list((3, 6, 9)), "n_estimators": list((10, 50, 100))}
grid = GridSearchCV(RandomForestRegressor(), param_grid=tree_param_grid, cv=5) # cv交叉验证(切分的是测试集)
grid.fit(X_train, y_train)
print(grid.grid_scores_)
print(grid.best_params_)
print(grid.best_score_)
rfr = RandomForestRegressor(min_samples_split=3, n_estimators=100, random_state=42)
rfr.fit(X_train, y_train)
rfr.score(X_test, y_test)
pd.Series(rfr.feature_importances_, index=housing.feature_names).sort_values(ascending=False)

相关文章推荐
- Python数据分析与机器学习-使用Kmeans进行图像压缩
- Python机器学习数据挖掘工具sklearn安装和使用
- 使用Python分析社交网络数据
- 利用 Python 进行数据分析(三)使用 IPython 提高开发效率
- Python下的机器学习工具sklearn--数据预处理
- 机器学习(八)使用sklearn库进行数据分析_——特征处理之过滤、包裹、嵌入型
- 使用python中的matplotlib进行绘图分析数据
- 数据预处理(3) ——数据归约 使用python(sklearn,pandas,numpy)实现
- 使用python抓取并分析数据-链家网(下)
- 使用Python分析社交网络数据
- 使用python中的matplotlib进行绘图分析数据
- 各种工具使得数据分析工作使用python变得越来越流行
- 如何使用Python工具分析风险数据
- 机器学习(九)使用sklearn库进行数据分析_——文本特征处理
- matplotlib -- 使用python中的matplotlib进行绘图分析数据
- Redis让Spark数据分析速度提升45倍(留作机器学习使用)
- 【Python】Python的数据分析(二)——pandas安装及使用
- 数据预处理(1) ——数据清洗 使用python(sklearn,pandas,numpy)实现
- 使用python进行数据分析