ES JVM使用如果超过75%就会GC较多,导致ES索引性能下降
2017-12-19 17:32
411 查看
转自:https://www.elastic.co/guide/en/cloud/current/ec-metrics-memory-pressure.html
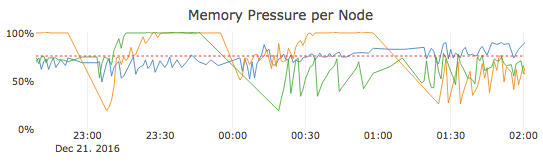
Now let’s suppose you have a cluster with three nodes and much higher memory pressure overall. In this example, two of the three nodes are maxing out very regularly for extended periods and one node is consistently hovering around the 75% mark where garbage collection kicks in.
High memory pressure works against cluster performance in two ways: As memory pressure rises to 75% and above, less memory remains available, but your cluster now also needs to spend some CPU resources to reclaim memory through garbage collection. These CPU resources are not available to handle user requests while garbage collection is going on. As a result, response times for user requests increases as the system becomes more and more resource constrained. If memory pressure continues to rise and reaches near 100%, a much more aggressive form of garbage collection is used, which will in turn affect cluster response times dramatically.
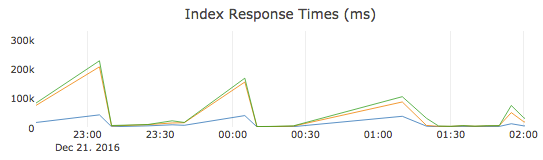
In our example, the Index Response Times metric shows that high memory pressure leads to a significant performance impact. As two of the three nodes max out their memory several times and plateau at 100% memory pressure for 30 to 45 minutes at a time, there is a sharp increase in the index response times around 23:00, 00:00, and 01:00. Search response times, which are not shown, also increase but not as dramatically. Only the node in blue that consistently shows a much healthier memory pressure that rarely exceeds 75% can sustain a lower response time.
If the performance impact from high memory pressure is not acceptable, you need to increase the cluster size or reduce the workload.
Scenario: How Does High Memory Pressure Affect Performance?
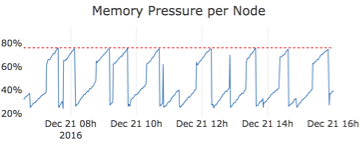
When you load up a cluster with an indexing and search workload that matches the size of the cluster well, you typically get the classic JVM heap sawtooth pattern as memory gets used and then gets freed up again by the garbage collector. Memory usage increases until it reaches 75% and then drops again as memory is freed up:Now let’s suppose you have a cluster with three nodes and much higher memory pressure overall. In this example, two of the three nodes are maxing out very regularly for extended periods and one node is consistently hovering around the 75% mark where garbage collection kicks in.
High memory pressure works against cluster performance in two ways: As memory pressure rises to 75% and above, less memory remains available, but your cluster now also needs to spend some CPU resources to reclaim memory through garbage collection. These CPU resources are not available to handle user requests while garbage collection is going on. As a result, response times for user requests increases as the system becomes more and more resource constrained. If memory pressure continues to rise and reaches near 100%, a much more aggressive form of garbage collection is used, which will in turn affect cluster response times dramatically.
In our example, the Index Response Times metric shows that high memory pressure leads to a significant performance impact. As two of the three nodes max out their memory several times and plateau at 100% memory pressure for 30 to 45 minutes at a time, there is a sharp increase in the index response times around 23:00, 00:00, and 01:00. Search response times, which are not shown, also increase but not as dramatically. Only the node in blue that consistently shows a much healthier memory pressure that rarely exceeds 75% can sustain a lower response time.
If the performance impact from high memory pressure is not acceptable, you need to increase the cluster size or reduce the workload.

相关文章推荐
- 使用SpringMVC提交数组时,如果list大小超过256,就会报错。
- 在SQL中使用now()导致的性能下降(MySQL)
- 在使用SMO时,检索IsSystemObject属性将导致性能急剧下降的解决方法
- js中的全局变量和静态变量的使用, js 的调试?- 如果js出错, js引擎 就会停止, 这会 导致 后面的 html中 refer 该函数时, 会报错 函数为定义!!
- MySQL笔记:select默认使用不当索引导致的巨大性能损失
- 在SQL中使用now()导致的性能下降(MySQL)
- ES 内存使用和GC指标——主节点每30秒会去检查其他节点的状态,如果任何节点的垃圾回收时间超过30秒(Garbage collection duration),则会导致主节点任务该节点脱离集群。
- 在使用SMO时,检索IsSystemObject属性将导致性能急剧下降的解决方法
- MySQL性能优化的21个最佳实践 和 mysql使用索引
- 在应用程序级别之外使用注册为 allowDefinition='MachineToApplication' 的节是错误的。如果在 IIS 中没有将虚拟目录配置为应用程序,则可能导致此错误。
- ORACLE 索引并行引起的direct path read temp和latch free等待导致进程数超过最大数
- oracle小记之游标和order by同时使用导致性能慢
- 如果系统要使用超大整数(超过long长度范围),请你设计一个数据结构来存储这种超大型数字以及设计一种算法来实现超大整数加法运算)
- oracle使用了索引但是查询性能没有改善(oracle的索引陷阱) 【转】
- PosgreSQL 索引 COLLATE 设置不当导致查询优化无法使用索引
- MAC PRO RETINA 下使用VMWARE以BOOTCAMP启动WIN8的性能下降一个档次
- Mysql多个LEFT JOIN使用ORDER不能使用索引导致查询过慢的解决方案
- 【转】MySQL索引使用方法和性能优化
- 搜索引擎会通过日志文件把用户每次检索使用的所有检索串都记录下来,每个查询串的长度为1-255字节。 假设目前有一千万个记录(这些查询串的重复度比较高, 虽然总数是1千万,但如果除去重复后,不超过3百
- 第六题:航天飞行器是一项复杂而又精密的仪器,飞行器的损耗主要集中在发射和降落的过程,科学家根据实验数据估计,如果在发射过程中,产生了 x 程度的损耗,那么在降落的过程中就会产生 x2 程度的损耗,如果飞船的总损耗超过了它的耐久度,飞行器就会爆炸坠毁。问一艘耐久度为 h 的飞行器,假设在飞行过程中不产生损耗,那么为了保证其可以安全的到达目的地,只考虑整数解,至多发射过程中可以承受多少程度的损耗?