python 数据科学 - 【分类模型】 ☞ 稳健滴 SVM 支持向量机
2017-09-25 11:19
645 查看
from sklearn.datasets import load_iris
from sklearn.svm import SVC
from sklearn.linear_model import LogisticRegression
iris = load_iris()
X = iris.data[0:100,[2,3]]
Y = iris.target[0:100]
'''
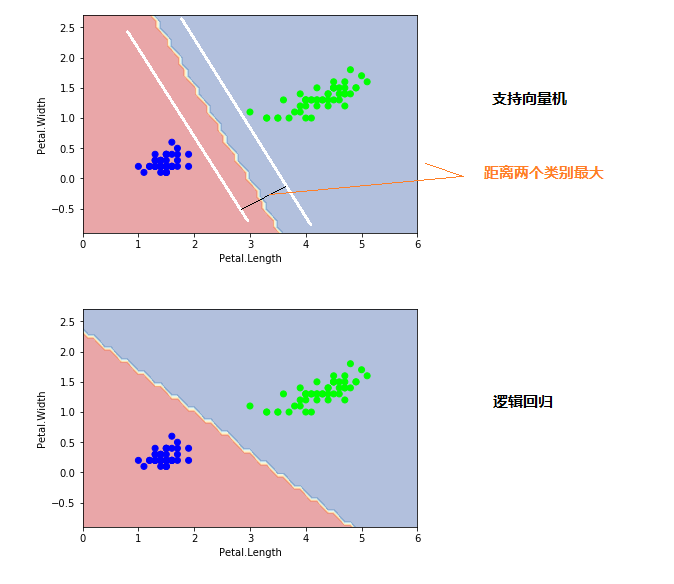
支持向量机:分界线距离两个类别的边界最远
'''
clf1 = SVC(kernel="linear")
clf1.fit(X, Y)
clf2 = LogisticRegression()
clf2.fit(X, Y)
from itertools import product
import numpy as np
import matplotlib.pyplot as plt
def plot_estimator(estimator, X, Y):
x0_min, x0_max = X[:, 0].min() - 1, X[:, 0].max() + 1
x1_min, x1_max = X[:, 1].min() - 1, X[:, 1].max() + 1
xx, yy = np.meshgrid(np.arange(x0_min, x0_max, 0.1),
np.arange(x1_min, x1_max, 0.1))
Z = estimator.predict(np.c_[xx.ravel(), yy.ravel()])
Z = Z.reshape(xx.shape)
plt.plot()
plt.contourf(xx, yy, Z, alpha=0.4, cmap = plt.cm.RdYlBu)
plt.scatter(X[:, 0], X[:, 1], c=Y, cmap = plt.cm.brg)
plt.xlabel('Petal.Length')
plt.ylabel('Petal.Width')
plt.show()plot_estimator(clf1, X, Y) plot_estimator(clf2, X, Y)
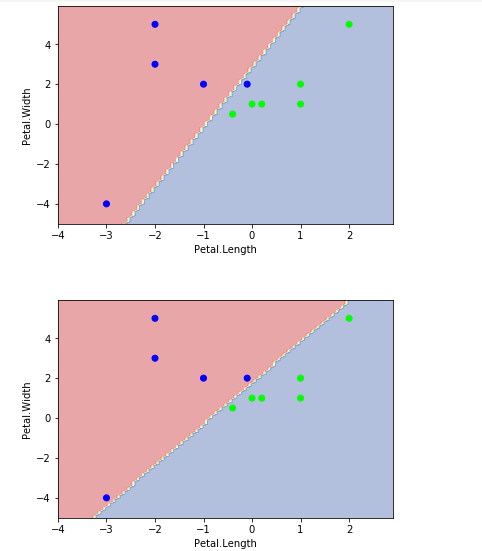
'''
C, 对错误(边界的某些点)的容忍度,C值越大越不能容忍,宽度越小。C值越小间隔宽度越大。
'''

data = np.array([[-1,2,0],[-2,3,0],[-2,5,0],[-3,-4,0],[-0.1,2,0],[0.2,1,1],[0,1,1],[1,2,1], [1,1,1], [-0.4,0.5,1],[2,5,1]])
X = data[:, :2]
Y = data[:,2]

# Large Margin
clf = SVC(C=1.0, kernel='linear')
clf.fit(X, Y)
plot_estimator(clf,X,Y)

# Narrow Margin
clf = SVC(C=100000, kernel='linear')
clf.fit(X, Y)
plot_estimator(clf,X,Y)
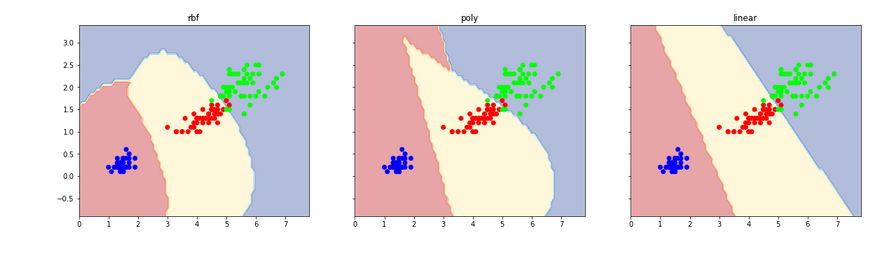
SVM Kernels
from itertools import product
import numpy as np
import matplotlib.pyplot as plt

from sklearn.datasets import load_iris
from sklearn.svm import SVC
'''
rbf,不规则线
poly,弧线
linear,直线(非线性数据不好使用)
'''
iris = load_iris()
X = iris.data[:,[2,3]]
Y = iris.target

clf1 = SVC(kernel="rbf")
clf1.fit(X, Y)

clf2 = SVC(kernel="poly")
clf2.fit(X, Y)

clf3 = SVC(kernel="linear")
clf3.fit(X, Y)

def plot_estimator(estimator, X, Y, idx, title):
x0_min, x0_max = X[:, 0].min() - 1, X[:, 0].max() + 1
x1_min, x1_max = X[:, 1].min() - 1, X[:, 1].max() + 1
xx, yy = np.meshgrid(np.arange(x0_min, x0_max, 0.1),
np.arange(x1_min, x1_max, 0.1))

Z = estimator.predict(np.c_[xx.ravel(), yy.ravel()])
Z = Z.reshape(xx.shape)

axarr[idx].contourf(xx, yy, Z, alpha=0.4, cmap = plt.cm.RdYlBu)
axarr[idx].scatter(X[:, 0], X[:, 1], c=Y,  cmap = plt.cm.brg)
axarr[idx].set_title(title)

f, axarr = plt.subplots(1, 3, sharex='col', sharey='row', figsize=(20, 5))

for idx, clf, title in zip([0,1,2],[clf1, clf2, clf3], ['rbf', 'poly', 'linear']):
plot_estimator(clf, X, Y, idx, title)
plt.show()
matplotlib.pyplot.subplots
matplotlib.pyplot

相关文章推荐
- python 数据科学 - 【分类模型】 ☞ 逻辑回归
- python 数据科学 - 【分类模型】 ☞ 决策树
- caffe:利用python分类,并可视化模型参数、数据
- Python数据挖掘-支持向量机SVM
- R语言使用支持向量机完成数据分类(SVM)
- 数据挖掘---分类算法之支持向量机SVM
- 数据挖掘学习------------------4-分类方法-7-支持向量机(SVM)
- 二分类支持向量机模型SVM知识点详解
- 数据挖掘笔记-分类-支持向量机SVM-1
- R︱mlr包帮你挑选最适合数据的机器学习模型(分类、回归)+机器学习python和R互查手册
- R︱mlr包帮你挑选最适合数据的机器学习模型(分类、回归)+机器学习python和R互查手册
- 数据挖掘---分类算法之支持向量机SVM
- python机器学习库sklearn——数据归一化、标准化、特征选择、逻辑回归、贝叶斯分类器、KNN模型、支持向量机、参数优化
- caffe:利用python分类,并可视化模型参数、数据
- 数据挖掘之决策树分类模型(…
- caffe:用自己的图像数据训练模型(图片分类)
- Python数据分析与机器学习-scikit-learn模型建立与评估
- Python实现SVM(支持向量机)
- 使用Python实现子区域数据分类统计
- 使用Python实现子区域数据分类统计