gprof, Valgrind and gperftools - an evaluation of some tools for application level CPU profiling on
2017-08-11 00:00
711 查看
In this post I give an overview of my evaluation of three different CPU profiling tools: gperftools, Valgrind and gprof. I evaluated the three tools on usage, functionality, accuracy and runtime overhead.
The usage of the different profilers is demonstrated with the small demo program cpuload, available via my github repository gklingler/cpuProfilingDemo. The intent of cpuload.cpp is just to generate some CPU load - it does nothing useful. The bash scripts in the same repo (which are also listed below) show how to compile/link the cpuload.cpp appropriately and execute the resulting executable to get the CPU profiling data.
Creating a CPU profile of your application with gprof requires the following steps:
compile and link the program with a compatible compiler and profiling enabled (e.g. gcc -pg).
execute your program to generate the profiling data file (default filename: gmon.out)
run gprof to analyze the profiling data
Let’s apply this to our demo application:
The gprof output consists of two parts: the flat profile and the call graph.
The flat profile reports the total execution time spent in each function and its percentage of the total running time. Function call counts are also reported. Output is sorted by percentage, with hot spots at the top of the list.
Gprof’s call graph is a textual call graph representation which shows the caller and callees of each function.
For detailed information on how to interpret the callgraph, take a look at the official documentation. You can also generate a graphical representation of the callgraph with gprof2dot - a tool to generate a graphical representation of the gprof callgraph)).
The overhead (mainly caused by instrumentation) can be quite high: estimated to 30-260%1 2.
gprof does not support profiling multi-threaded applications and also cannot profile shared libraries. Even if there exist workarounds to get threading support3, the fact that it cannot profile calls into shared libraries, makes it totally unsuitable for today’s real-world projects.
For analyzing the collected profiling data, there is is the amazing visualization tool KCachegrind5. It represents the collected data in a very nice way what tremendously helps to get an overview about whats going on.
Creating a CPU profile of your application with valgrind/callgrind is really simple and requires the following steps:
compile your program with debugging symbols enabled (to get a meaningful call-graph)
execute your program with valgrind
analyze your profiling data with e.g. KCachegrind
Let’s apply this our demo application (profile_valgrind.sh):
In contrast to gprof, we don’t need to rebuild our application with any special compile flags. We can execute any executable as it is with valgrind. Of course the executed program should contain debugging information to get an expressive call graph with human readable symbol names.
Below you see a KCachegrind with the profiling data of our cpuload demo:
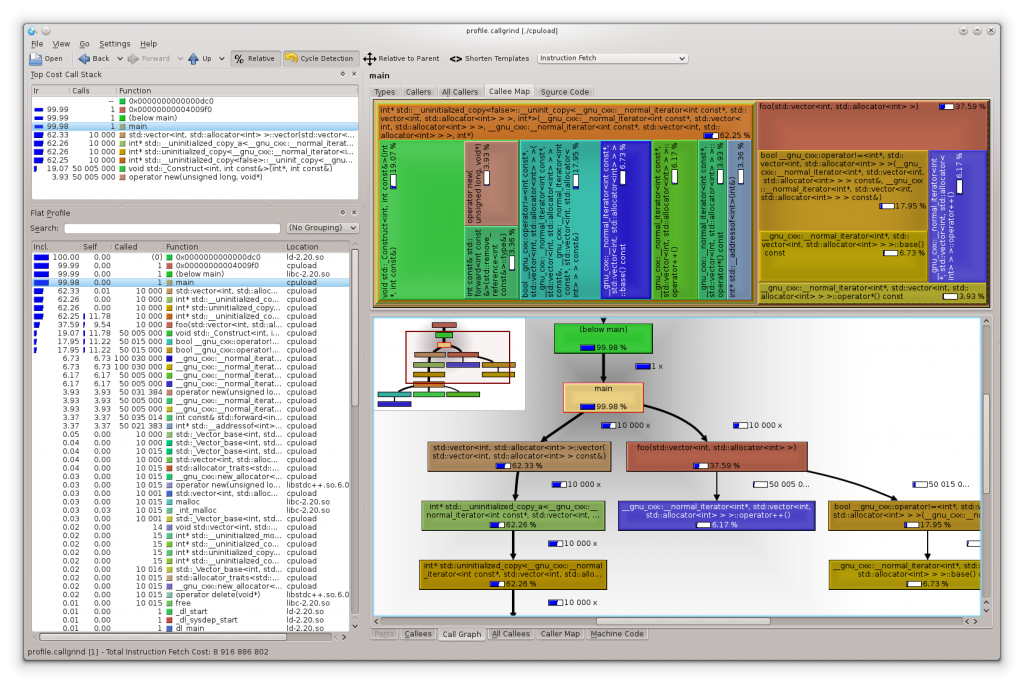
A downside of Valgrind is the enormous slowdown of the profiled application (around a factor of 50x) what makes it impracticable to use for larger/longer running applications. The profiling result itself is not influenced by the measurement.
Creating a CPU profile of selected parts of your application with gperftools requires the following steps:
compile your program with debugging symbols enabled (to get a meaningful call graph) and link gperftools profiler.so
execute your program to generate the profiling data file(s)
To analyze the profiling data, use pprof (distributed with gperftools) or convert it to a callgrind compatible format and analyze it with KCachegrind
Let’s apply this our demo application (profile_gperftools.sh):
Alternatively, profiling the whole application can be done without any changes or recompilation/linking, but I will not cover this here as this is not the recommended approach. But you can find more about this in the docs.
The gperftools profiler can profile multi-threaded applications. The run time overhead while profiling is very low and the applications run at “native speed”. We can again use KCachegrind for analyzing the profiling data after converting it to a cachegrind compatible format. I also like the possibility to be able to selectively profile just certain areas of the code, and if you want to, you can easily extend your program to enable/disable profiling at runtime.
Valgrind delivers the most accurate results and is well suited for multi-threaded applications. It’s very easy to use and there is KCachegrind for visualization/analysis of the profiling data, but the slow execution of the application under test disqualifies it for larger, longer running applications.
The gperftools CPU profiler has a very little runtime overhead, provides some nice features like selectively profiling certain areas of interest and has no problem with multi-threaded applications. KCachegrind can be used to analyze the profiling data. Like all sampling based profilers, it suffers statistical inaccuracy and therefore the results are not as accurate as with Valgrind, but practically that’s usually not a big problem (you can always increase the sampling frequency if you need more accurate results). I’m using this profiler on a large code-base and from my personal experience I can definitely recommend using it.
I hope you liked this post and as always, if you have questions or any kind of feedback please leave a comment below.
GNU gprof Profiler ↑
Low-Overhead Call Path Profiling of Unmodified, Optimized Code for higher order object oriented programs, Yu Kai Hong, Department of Mathematics at National Taiwan University; July 19, 2008, ACM 1-59593-167/8/06/2005 ↑
workaround to use gprof with multithreaded applications ↑
Valgrind ↑
KCachegrind ↑
The usage of the different profilers is demonstrated with the small demo program cpuload, available via my github repository gklingler/cpuProfilingDemo. The intent of cpuload.cpp is just to generate some CPU load - it does nothing useful. The bash scripts in the same repo (which are also listed below) show how to compile/link the cpuload.cpp appropriately and execute the resulting executable to get the CPU profiling data.
gprof
The GNU profiler gprof uses a hybrid approach of compiler assisted instrumentation and sampling. Instrumentation is used to gather function call information (e.g. to be able to generate call graphs and count the number of function calls). To gather profiling information at runtime, a sampling process is used. This means, that the program counter is probed at regular intervals by interrupting the program with operating system interrupts. As sampling is a statistical process, the resulting profiling data is not exact but are rather a statistical approximation gprof statistical inaccuracy.Creating a CPU profile of your application with gprof requires the following steps:
compile and link the program with a compatible compiler and profiling enabled (e.g. gcc -pg).
execute your program to generate the profiling data file (default filename: gmon.out)
run gprof to analyze the profiling data
Let’s apply this to our demo application:
#!/bin/bash

# build the program with profiling support (-gp)
g++ -std=c++11 -pg cpuload.cpp -o cpuload

# run the program; generates the profiling data file (gmon.out)
./cpuload

# print the callgraph
gprof cpuload
The gprof output consists of two parts: the flat profile and the call graph.
The flat profile reports the total execution time spent in each function and its percentage of the total running time. Function call counts are also reported. Output is sorted by percentage, with hot spots at the top of the list.
Gprof’s call graph is a textual call graph representation which shows the caller and callees of each function.
For detailed information on how to interpret the callgraph, take a look at the official documentation. You can also generate a graphical representation of the callgraph with gprof2dot - a tool to generate a graphical representation of the gprof callgraph)).
The overhead (mainly caused by instrumentation) can be quite high: estimated to 30-260%1 2.
gprof does not support profiling multi-threaded applications and also cannot profile shared libraries. Even if there exist workarounds to get threading support3, the fact that it cannot profile calls into shared libraries, makes it totally unsuitable for today’s real-world projects.
valgrind/callgrind
Valgrind4 is an instrumentation framework for building dynamic analysis tools. Valgrind is basically a virtual machine with just in time recompilation of x86 machine code to some simpler RISC-like intermediate code: UCode. It does not execute x86 machine code directly but it “simulates” the on the fly generated UCode. There are various Valgrind based tools for debugging and profiling purposes. Depending on the chosen tool, the UCode is instrumented appropriately to record the data of interest. For performance profiling, we are interested in the tool callgrind: a profiling tool that records the function call history as a call-graph.For analyzing the collected profiling data, there is is the amazing visualization tool KCachegrind5. It represents the collected data in a very nice way what tremendously helps to get an overview about whats going on.
Creating a CPU profile of your application with valgrind/callgrind is really simple and requires the following steps:
compile your program with debugging symbols enabled (to get a meaningful call-graph)
execute your program with valgrind
--tool=callgrind ./yourprogramto generate the profiling data file
analyze your profiling data with e.g. KCachegrind
Let’s apply this our demo application (profile_valgrind.sh):
#!/bin/bash

# build the program (no special flags are needed)
g++ -std=c++11 cpuload.cpp -o cpuload

# run the program with callgrind; generates a file callgrind.out.12345 that can be viewed with kcachegrind
valgrind --tool=callgrind ./cpuload

# open profile.callgrind with kcachegrind
kcachegrind profile.callgrind
In contrast to gprof, we don’t need to rebuild our application with any special compile flags. We can execute any executable as it is with valgrind. Of course the executed program should contain debugging information to get an expressive call graph with human readable symbol names.
Below you see a KCachegrind with the profiling data of our cpuload demo:
A downside of Valgrind is the enormous slowdown of the profiled application (around a factor of 50x) what makes it impracticable to use for larger/longer running applications. The profiling result itself is not influenced by the measurement.
gperftools
Gperftools from Google provides a set of tools aimed for analyzing and improving performance of multi-threaded applications. They offer a CPU profiler, a fast thread aware malloc implementation, a memory leak detector and a heap profiler. We focus on their sampling based CPU profiler.Creating a CPU profile of selected parts of your application with gperftools requires the following steps:
compile your program with debugging symbols enabled (to get a meaningful call graph) and link gperftools profiler.so
#include <gperftools/profiler.h>and surround the sections you want to profile with
ProfilerStart("nameOfProfile.log"); and ProfilerStop();
execute your program to generate the profiling data file(s)
To analyze the profiling data, use pprof (distributed with gperftools) or convert it to a callgrind compatible format and analyze it with KCachegrind
Let’s apply this our demo application (profile_gperftools.sh):
#!/bin/bash

# build the program; For our demo program, we specify -DWITHGPERFTOOLS to enable the gperftools specific #ifdefs
g++ -std=c++11 -DWITHGPERFTOOLS -lprofiler -g ../cpuload.cpp -o cpuload

# run the program; generates the profiling data file (profile.log in our example)
./cpuload

# convert profile.log to callgrind compatible format
pprof --callgrind ./cpuload profile.log > profile.callgrind

# open profile.callgrind with kcachegrind
kcachegrind profile.callgrind
Alternatively, profiling the whole application can be done without any changes or recompilation/linking, but I will not cover this here as this is not the recommended approach. But you can find more about this in the docs.
The gperftools profiler can profile multi-threaded applications. The run time overhead while profiling is very low and the applications run at “native speed”. We can again use KCachegrind for analyzing the profiling data after converting it to a cachegrind compatible format. I also like the possibility to be able to selectively profile just certain areas of the code, and if you want to, you can easily extend your program to enable/disable profiling at runtime.
Conclusion and comparison
gprof is the dinosaur among the evaluated profilers - its roots go back into the 1980’s. It seems it was widely used and a good solution during the past decades. But its limited support for multi-threaded applications, the inability to profile shared libraries and the need for recompilation with compatible compilers and special flags that produce a considerable runtime overhead, make it unsuitable for using it in today’s real-world projects.Valgrind delivers the most accurate results and is well suited for multi-threaded applications. It’s very easy to use and there is KCachegrind for visualization/analysis of the profiling data, but the slow execution of the application under test disqualifies it for larger, longer running applications.
The gperftools CPU profiler has a very little runtime overhead, provides some nice features like selectively profiling certain areas of interest and has no problem with multi-threaded applications. KCachegrind can be used to analyze the profiling data. Like all sampling based profilers, it suffers statistical inaccuracy and therefore the results are not as accurate as with Valgrind, but practically that’s usually not a big problem (you can always increase the sampling frequency if you need more accurate results). I’m using this profiler on a large code-base and from my personal experience I can definitely recommend using it.
I hope you liked this post and as always, if you have questions or any kind of feedback please leave a comment below.
GNU gprof Profiler ↑
Low-Overhead Call Path Profiling of Unmodified, Optimized Code for higher order object oriented programs, Yu Kai Hong, Department of Mathematics at National Taiwan University; July 19, 2008, ACM 1-59593-167/8/06/2005 ↑
workaround to use gprof with multithreaded applications ↑
Valgrind ↑
KCachegrind ↑

相关文章推荐
- valgrind - a suite of tools for debugging and profiling programs
- Handbook of Research on User Interface Design and Evaluation for Mobile Technology
- TACAS(International Conference on Tools and Algorithms for the Construction and Analysis of Systems)到底是什么档次的会议?
- TACAS(International Conference on Tools and Algorithms for the Construction and Analysis of Systems)到底是什么档次的会议?
- 1.4 Dynamically change the look of an application by using view states,transitions and effects
- List of Microsoft patterns and practices for Application Architecture and Design
- Frame- and Segment-Level Features and Candidate Pool Evaluation for Video Caption Generation
- PatentTips - Method and system for browsing things of internet of things on ip using web platform
- 行人属性“Weakly-supervised Learning of Mid-level Features for Pedestrian Attribute Recognition and Loca”
- Could not install the app on the device, read the error above for details. Make sure you have an And
- Shell script for logging cpu and memory usage of a Linux process
- arcgis server manager - An error has occured on the server. For details please check the Event (Application) log on the web.
- Can we use function on left side of an expression in C and C++?
- 每日论文Transient Attributes for High-Level Understanding and Editing of Outdoor Scenes
- Swift: 消除警告-Scene is unreachable due to lack of entry points and does not have an identifier for
- Scene is unreachable due to lack of entry points and does not have an identifier for runtime access
- Scene is unreachable due to lack of entry points and does not have an identifier for runtime access
- Method and apparatus for training a memory signal via an error signal of a memory
- And that’s what the lowest level of the Libevent API does for you