Windows10+Python3下安装NumPy+SciPy+Matplotlib
2017-06-27 18:05
781 查看
Numpy、SciPy、MatplotLib是Python下从事科学计算必不可少的库。我在用其他的方法安装时出现各种问题,发现直接安装.whl包是最快且不报错的方法。
1.下载.whl包
在下面的网站中找需要的.whl文件下载
http://www.lfd.uci.edu/~gohlke/pythonlibs/
要和自己本地安装的版本一致,我选择的whl文件是:
numpy-1.13.0+mkl-cp36-cp36m-win32.whl
scipy-0.19.1-cp36-cp36m-win32.whl
matplotlib-2.0.2-cp36-cp36m-win32.whl
2.开始在命令行安装
>pip3 install c:\(whl文件下载的路径)\numpy-1.13.0+mkl-cp36-cp36m-win32.whl
>pip3 install c:\(whl文件下载的路径)\scipy-0.19.1-cp36-cp36m-win32.whl
>pip3 install c:\(whl文件下载的路径)\matplotlib-2.0.2-cp36-cp36m-win32.whl
如果不出意外,这就都安装好了。
3.开始测试
测试代码来自:http://www.cnblogs.com/jasonfreak/p/5441512.html 感谢作者
运行结果:
drawBar(grades)
drawPie(grades)
drawHist(heights)
drawCumulativeHist(heights)
drawScatter(heights, weights)
drawBox(heights)
成功!
1.下载.whl包
在下面的网站中找需要的.whl文件下载
http://www.lfd.uci.edu/~gohlke/pythonlibs/
要和自己本地安装的版本一致,我选择的whl文件是:
numpy-1.13.0+mkl-cp36-cp36m-win32.whl
scipy-0.19.1-cp36-cp36m-win32.whl
matplotlib-2.0.2-cp36-cp36m-win32.whl
2.开始在命令行安装
>pip3 install c:\(whl文件下载的路径)\numpy-1.13.0+mkl-cp36-cp36m-win32.whl
>pip3 install c:\(whl文件下载的路径)\scipy-0.19.1-cp36-cp36m-win32.whl
>pip3 install c:\(whl文件下载的路径)\matplotlib-2.0.2-cp36-cp36m-win32.whl
如果不出意外,这就都安装好了。
3.开始测试
测试代码来自:http://www.cnblogs.com/jasonfreak/p/5441512.html 感谢作者
from numpy import array
from numpy.random import normal
from matplotlib import pyplot
def genData():
heights = []
weights = []
grades = []
N = 10000
for i in range(N):
while True:
# 身高服从均值172,标准差为6的正态分布
height = normal(172, 6)
if 0 < height: break
while True:
# 体重由身高作为自变量的线性回归模型产生,误差服从标准正态分布
weight = (height - 80) * 0.7 + normal(0, 1)
if 0 < weight: break
while True:
# 分数服从均值为70,标准差为15的正态分布
score = normal(70, 15)
if 0 <= score and score <= 100:
grade = 'E' if score < 60 else (
'D' if score < 70 else ('C' if score < 80 else ('B' if score < 90 else 'A')))
break
heights.append(height)
weights.append(weight)
grades.append(grade)
return array(heights), array(weights), array(grades)
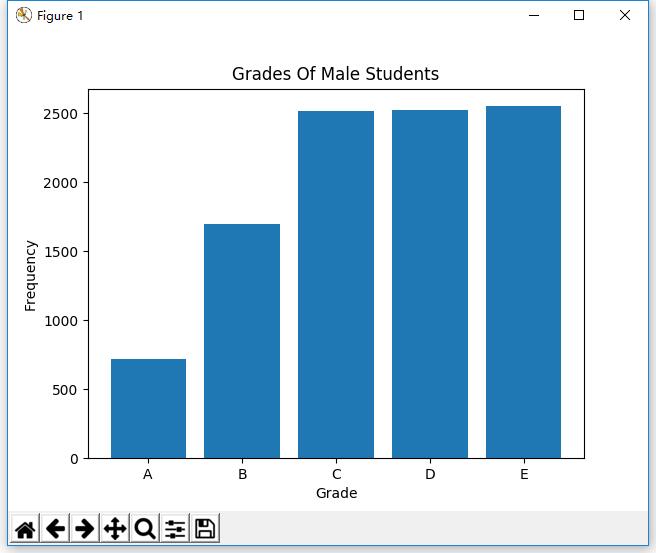
# 绘制柱状图
def drawBar(grades):
xticks = ['A', 'B', 'C', 'D', 'E']
gradeGroup = {}
# 对每一类成绩进行频数统计
for grade in grades:
gradeGroup[grade] = gradeGroup.get(grade, 0) + 1
# 创建柱状图
# 第一个参数为柱的横坐标
# 第二个参数为柱的高度
# 参数align为柱的对齐方式,以第一个参数为参考标准
pyplot.bar(range(5), [gradeGroup.get(xtick, 0) for xtick in xticks], align='center')
# 设置柱的文字说明
# 第一个参数为文字说明的横坐标
# 第二个参数为文字说明的内容
pyplot.xticks(range(5), xticks)
# 设置横坐标的文字说明
pyplot.xlabel('Grade')
# 设置纵坐标的文字说明
pyplot.ylabel('Frequency')
# 设置标题
pyplot.title('Grades Of Male Students')
# 绘图
pyplot.show()
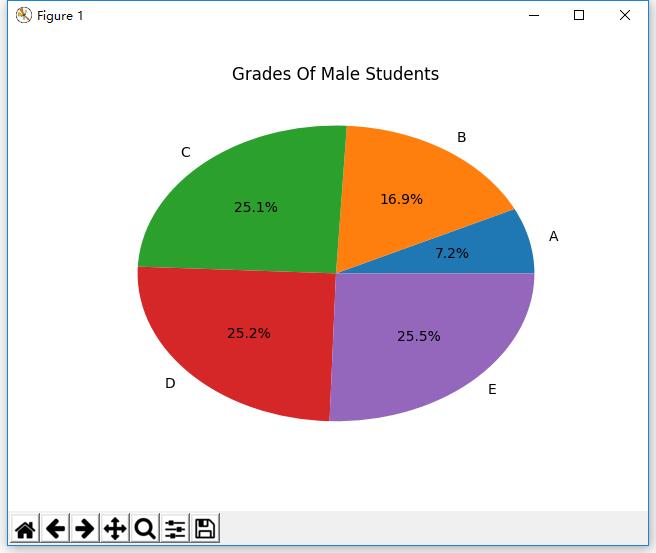
#绘制饼形图
def drawPie(grades):
labels = ['A', 'B', 'C', 'D', 'E']
gradeGroup = {}
for grade in grades:
gradeGroup[grade] = gradeGroup.get(grade, 0) + 1
#创建饼形图
#第一个参数为扇形的面积
#labels参数为扇形的说明文字
#autopct参数为扇形占比的显示格式
pyplot.pie([gradeGroup.get(label, 0) for label in labels], labels=labels, autopct='%1.1f%%')
pyplot.title('Grades Of Male Students')
pyplot.show()
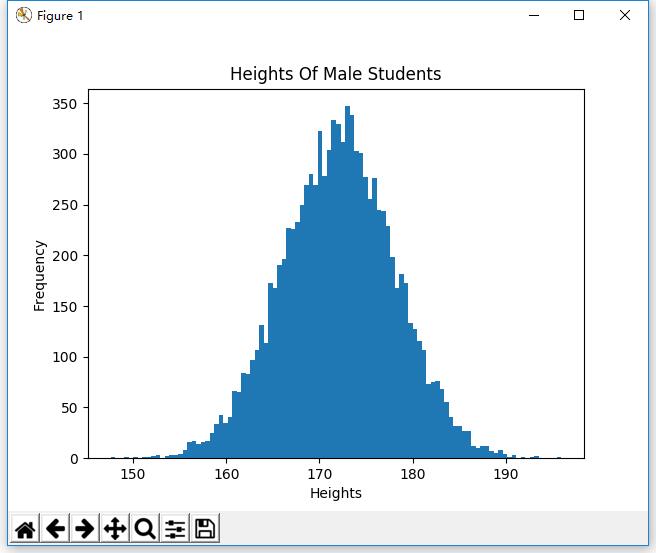
#绘制直方图
def drawHist(heights):
#创建直方图
#第一个参数为待绘制的定量数据,不同于定性数据,这里并没有事先进行频数统计
#第二个参数为划分的区间个数
pyplot.hist(heights, 100)
pyplot.xlabel('Heights')
pyplot.ylabel('Frequency')
pyplot.title('Heights Of Male Students')
pyplot.show()
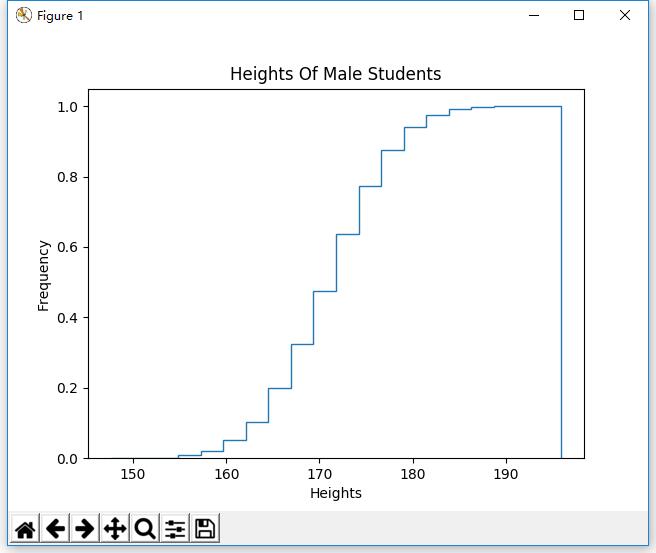
#绘制累积曲线
def drawCumulativeHist(heights):
#创建累积曲线
#第一个参数为待绘制的定量数据
#第二个参数为划分的区间个数
#normed参数为是否无量纲化
#histtype参数为'step',绘制阶梯状的曲线
#cumulative参数为是否累积
pyplot.hist(heights, 20, normed=True, histtype='step', cumulative=True)
pyplot.xlabel('Heights')
pyplot.ylabel('Frequency')
pyplot.title('Heights Of Male Students')
pyplot.show()
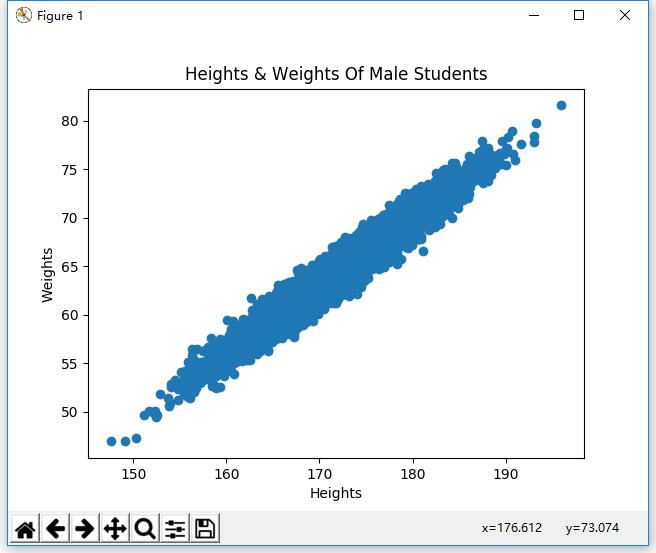
#绘制散点图
def drawScatter(heights, weights):
#创建散点图
#第一个参数为点的横坐标
#第二个参数为点的纵坐标
pyplot.scatter(heights, weights)
pyplot.xlabel('Heights')
pyplot.ylabel('Weights')
pyplot.title('Heights & Weights Of Male Students')
pyplot.show()
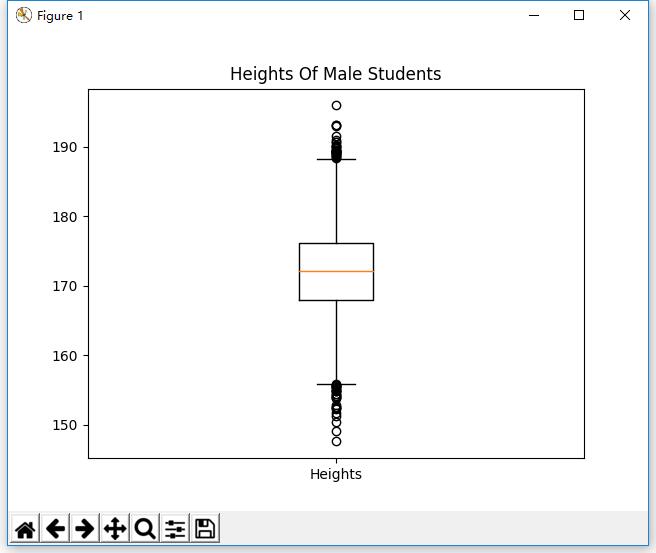
#绘制箱形图
def drawBox(heights):
#创建箱形图
#第一个参数为待绘制的定量数据
#第二个参数为数据的文字说明
pyplot.boxplot([heights], labels=['Heights'])
pyplot.title('Heights Of Male Students')
pyplot.show()
data = genData()
print(data)
heights = data[0]
weights = data[1]
grades = data[2]
drawBar(grades)
drawPie(grades)
drawHist(heights)
drawCumulativeHist(heights)
drawScatter(heights, weights)
drawBox(heights)运行结果:
drawBar(grades)
drawPie(grades)
drawHist(heights)
drawCumulativeHist(heights)
drawScatter(heights, weights)
drawBox(heights)
成功!

相关文章推荐
- Windows10+Python3.6下安装NumPy+SciPy+Matplotlib(转改)
- Windows10+Python3.6下安装NumPy+SciPy+Matplotlib
- python及常用库numpy、scipy、matplotlib安装与卸载-Windows环境
- 在Windows Python3.4 上安装NumPy、Matplotlib、SciPy和IPython
- windows+Mac下安装Python以及科学计算套装安装(scipy、numpy、matplotlib)
- Windows64位下各版本Python安装numpy,SciPy,matplotlib,Ipython模块
- windows 安装python3.6(numpy,scipy,pandas,matplotlib,scikit-learn)
- 在windows上安装python的机器学习包numpy scipy scikit_learn matplotlib
- windows安装python+numpy+scipy+matplotlib+pandas+beautifulsoup
- windows 安装python3.6(numpy,scipy,pandas,matplotlib,scikit-learn)
- windows环境下python2.7、pycharm、numpy_mkl、scipy、sklearn、Matplotlib、jupyter完整安装教程
- windows下安装python及第三方库numpy、scipy、matplotlib终极版
- 在windows下python,pip,numpy,scipy,matplotlib的安装
- windows 安装python3.6(numpy,scipy,pandas,matplotlib,scikit-learn)
- win10+python3.6安装numpy,scipy,scikit-learn,matplotlib
- windows环境下python2.7、pycharm、numpy_mkl、scipy、sklearn、Matplotlib、jupyter完整安装教程
- windows 安装python3.6(numpy,scipy,pandas,matplotlib,scikit-learn)
- 在windows下python,pip,numpy,scipy,matplotlib的安装 系统:win7(64bit)
- 在windows下python,pip,numpy,scipy,matplotlib的安装
- windows64位环境下python安装numpy、scipy和matplotlib