React 和 D3 构建的图表库 Recharts
2017-06-09 14:41
489 查看
Recharts 是一个用 React 和 D3构建的重新定义的图表库。这个库能帮助你在 React 应用中轻易绘制图表,Recharts 的主要特点:简单地使用 React 组件进行部署支持原生 SVG,轻量级应用一些 D3 子模块示例: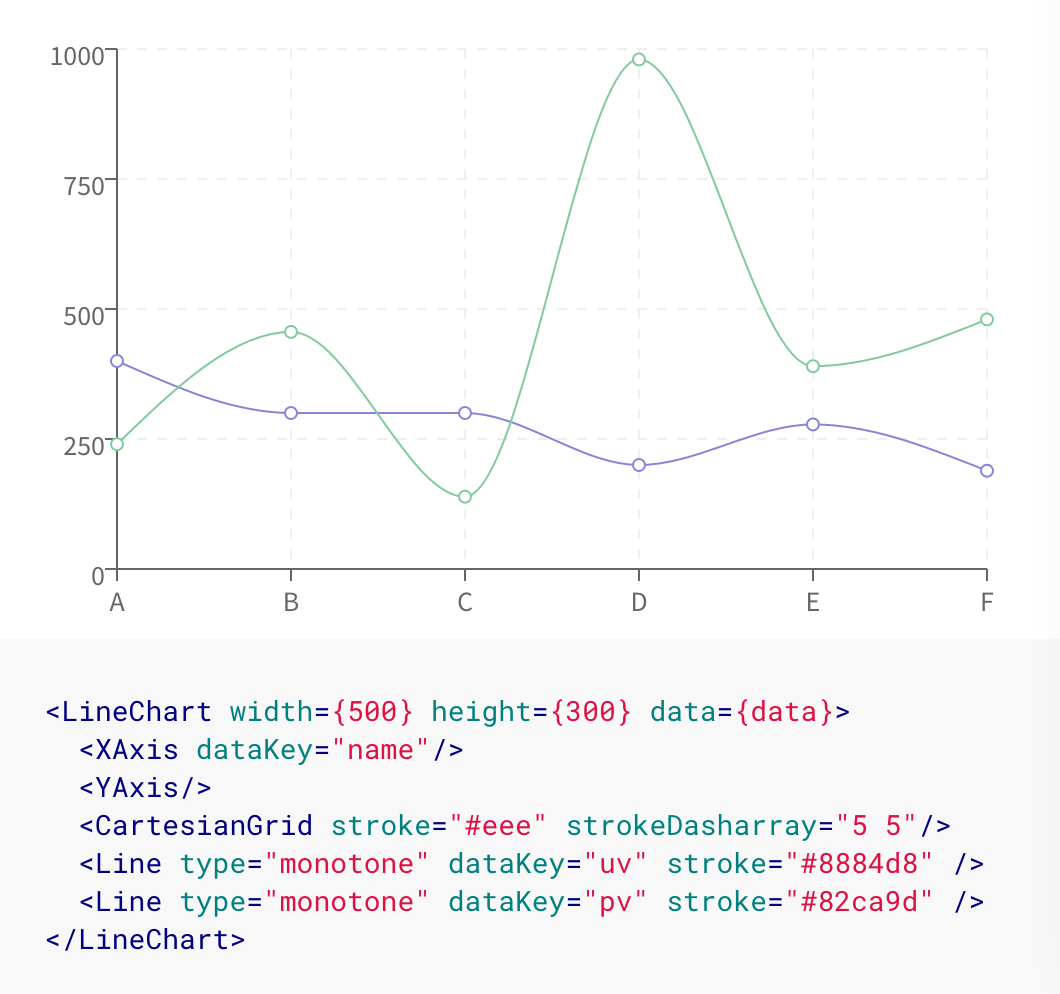 Recharts 的所有组件都十分有条理地分离。lineCharts 由 x 轴, tooltip, grid, and line items 组成,它们每个都是独立的 React 组件。有条理地分离和组合是 Recharts 所遵循的原则之一。Module Formatsbabel-plugin-recharts A simple transform to cherry-pick Recharts modules soyou don’t have to.
master分支代码最近更新:2017-06-06下载zip扩展链接 https://zhuanlan.zhihu.com/p/20641029?refer=purerender
Recharts 的所有组件都十分有条理地分离。lineCharts 由 x 轴, tooltip, grid, and line items 组成,它们每个都是独立的 React 组件。有条理地分离和组合是 Recharts 所遵循的原则之一。Module Formatsbabel-plugin-recharts A simple transform to cherry-pick Recharts modules soyou don’t have to.recharts / recharts
Watch115 Star5791 Fork382Redefined chart library built with React and D3 — More...http://recharts.org| Issues | ||
| #726 | can i change the svg's width? | by yokeyang 2017-06-07 |
| #723 | None of the pie charts are working on the homepage | by oliverwatkins 2017-06-07 |
| #725 | connectNulls Propertie in Line don't works | by pbdm 2017-06-07 |
| #724 | Mixed components | by txgruppi 2017-06-06 |
| #287 | Real-time chart | by sdoomz 2017-06-06 |

相关文章推荐
- 构建用于生产的React静态化单页面服务
- react,react-router 4,mobx构建我的移动端web
- 如何用 React 构建前端架构
- React Native图表插件react-native-charts-wrapper集成教程
- 大数据时代的图表可视化利器——highcharts,D3和百度的echarts
- 使用React-route和Webpack快速构建一个react程序
- 从零开始,教你用Webpack构建React基础工程
- 用react + react-redux构建项目 基本配置
- 从零开始,教你用Webpack构建React基础工程
- React-native学习(一):构建第一个Android项目
- react构建淘票票webapp,及react与vue的简单比较。
- 慕课笔记--[课程]使用React构建一款音乐播放器
- 大数据时代的图表可视化利器——highcharts,D3和百度的echarts
- d3图表中饼图的使用示例
- Create-react-app 构建react环境
- React-Native开发总结+构建-调试-基础归纳总结
- webpack---使用插件,常见webpack的plugin,构建vue,react单页面/多页面工程APP必备插件
- 从0开始用react构建音乐播放器
- 解决:使用create-react-app构建react应用很慢
- [react001] 使用webpack自动构建react 项目