matplotlib text 文字处理
2017-05-08 00:00
155 查看
1.4.处理文字
text()命令可以在任意的位置添加文字,xlabel(),ylabel(),title()分别是添加x轴,y轴标签和标题。
所有的text()命令会返回一个matplotlib.text.Text实例,通过属性或者setp()来改变他们。
t = plt.xlabel(‘my data’, fontsize=14, color=’red’)
1.4.1 使用数学表达式
前置的r是指定它后面的字符串是原始的字符串,然后用$包裹表示中间的是数学表达式,\表示转译具体的数学符号。
4.2 注释
annotate()方法提供了一个注释的方法。
annotate(string,xy,xytest,arrowprops)
默认的情况下,xy和xytext使用的坐标是数据的坐标,你也可以指定其他的坐标系统。
text()命令可以在任意的位置添加文字,xlabel(),ylabel(),title()分别是添加x轴,y轴标签和标题。
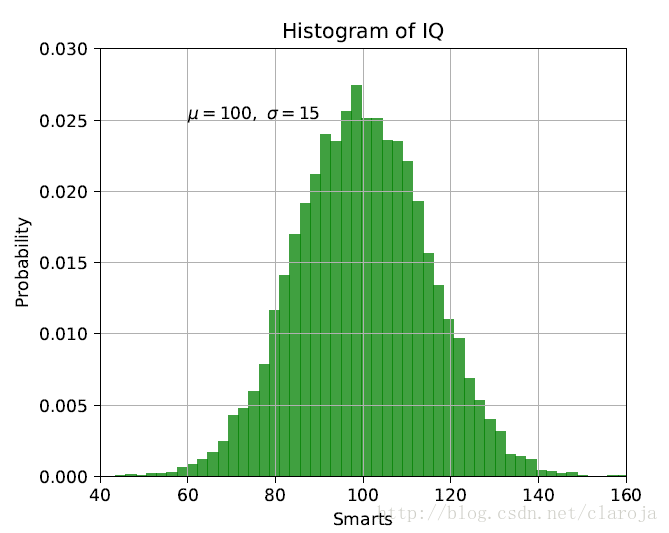
import numpy as np
import matplotlib.pyplot as plt
# Fixing random state for reproducibility
np.random.seed(19680801)
mu, sigma = 100, 15
x = mu + sigma * np.random.randn(10000)
# the histogram of the data
n, bins, patches = plt.hist(x, 50, normed=1, facecolor='g', alpha=0.75)
plt.xlabel('Smarts')
plt.ylabel('Probability')
plt.title('Histogram of IQ')
plt.text(60, .025, r'$\mu=100,\ \sigma=15$')
plt.axis([40, 160, 0, 0.03])
plt.grid(True)
plt.show()
所有的text()命令会返回一个matplotlib.text.Text实例,通过属性或者setp()来改变他们。
t = plt.xlabel(‘my data’, fontsize=14, color=’red’)
1.4.1 使用数学表达式
plt.title(r'$\sigma_i=15$')
前置的r是指定它后面的字符串是原始的字符串,然后用$包裹表示中间的是数学表达式,\表示转译具体的数学符号。
4.2 注释
annotate()方法提供了一个注释的方法。
annotate(string,xy,xytest,arrowprops)
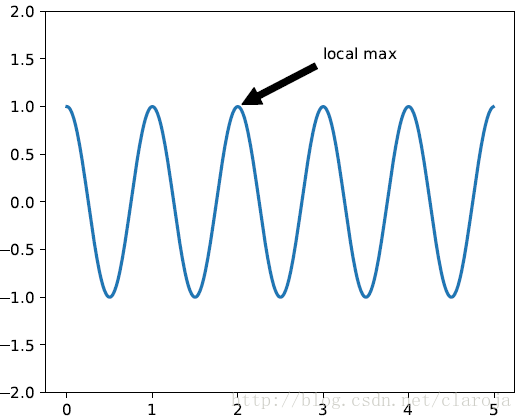
import numpy as np
import matplotlib.pyplot as plt
ax = plt.subplot(111)
t = np.arange(0.0, 5.0, 0.01)
s = np.cos(2*np.pi*t)
line, = plt.plot(t, s, lw=2)
plt.annotate('local max', xy=(2, 1), xytext=(3, 1.5),
arrowprops=dict(facecolor='black', shrink=0.05),
)
plt.ylim(-2,2)
plt.show()
默认的情况下,xy和xytext使用的坐标是数据的坐标,你也可以指定其他的坐标系统。

相关文章推荐
- matplotlib text 文字处理
- matplotlib绘图、图片处理、绘制文字
- matplotlib命令与格式:标题(title),标注(annotate),文字说明(text)
- python matplotlib 安装 和错误处理
- matplotlib处理科学计算数据-L2
- matplotlib入门之图像处理
- from matplotlib import pyplot 报错处理
- Python之matplotlib安装以及错误处理
- scikit-image/matplotlib处理图像知识点 2017 7.15
- Python地理数据处理之Matplotlib安装使用
- Matplotlib 饼状图中的文字中文乱码问题
- 2-python图像处理之Matplotlib
- matplotlib —— 添加文本信息(text)
- matplotlib模块数据可视化-图片处理
- scipy 图像处理(scipy.misc、scipy.ndimage)、matplotlib 图像处理
- matplotlib处理科学计算数据-L1
- matplotlib —— 添加文本信息(text)
- matplotlib处理科学计算数据-L3
- matplotlib的图片文字乱码
- matplotlib中的warning处理