ELKStack 基础介绍之 Logstash [三]
2017-04-14 09:43
204 查看
ELKStack 基础介绍之 Logstash [三]
标签(空格分隔): ELKStack一、Logstash介绍
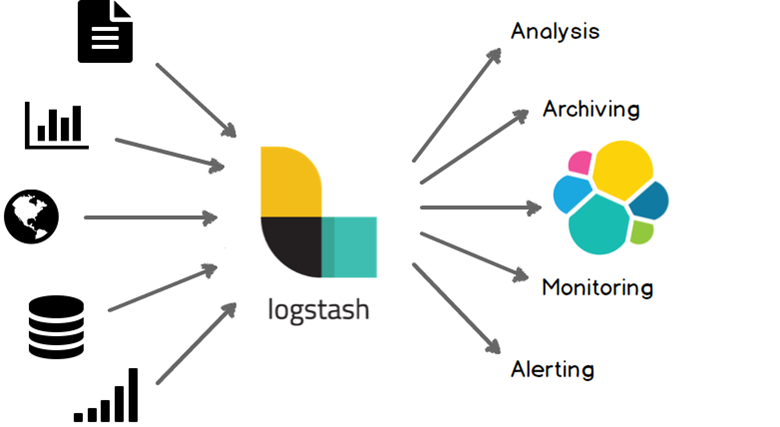
Logstash是一个完全开源的工具,他可以对你的日志进行收集、分析,并将其存储供以后使用(如,搜索),您可以使用它。说到搜索,logstash带有一个web界面,搜索和展示所有日志。
kibana也是一个开源和免费的工具,他可以帮助您汇总、分析和搜索重要数据日志并提供友好的web界面。他可以为 Logstash 和 ElasticSearch 提供的日志分析的 Web 界面。
提示: logstash与es没有任何关系
ELK几个概念
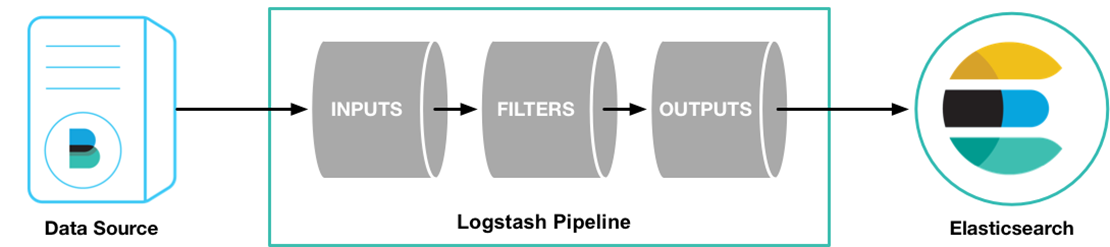
INPUT
OUTPUT
首先LogStash是收集日志,它收集完日志就需要把日志存储下来,所以我们可以用运输者的身份来表示LogStash(INPUT or OUTPUT)LogStash可以在日志发送之前做一个过滤(OUTPUT之前)
二、LogStash部署与配置
和Elasticsearch一样,在开始部署LogStash之前也需要你的环境中正确的安装的JDK。可以下载安装Oracle的JDK或者使用 yum安装openjdk。LogStash三大功能
INPUT  进
FILTER  (支持过滤的功能)
OUTPUT 出
1.设置时区
[root@abcdocker ~]# yum install ntpdate –y
[root@abcdocker ~]# ntpdate time1.aliyun.com
[root@abcdocker ~]# timedatectl set-timezone Asia/Shanghai  #设置时区
另一种设置时区方法
[root@abcdocker ~]# cp /usr/share/zoneinfo/Asia/Shanghai /etc/localtime
像我这样高逼格的玩家一般都把这种命令用一条显示
[root@abcdocker ~]# yum install ntpdate -y && ntpdate time1.aliyun.com && timedatectl set-timezone Asia/Shanghai
2.安装JDK
[root@abcdocker ~]# yum install -y java
[root@abcdocker ~]# java -version
openjdk version "1.8.0_65"
OpenJDK Runtime Environment (build 1.8.0_65-b17)
OpenJDK 64-Bit Server VM (build 25.65-b01, mixed mode)
3.YUM部署LogStash
下载并安装GPG key
[root@abcdocker ~]# rpm --import https://packages.elastic.co/GPG-KEY-elasticsearch[/code]
我们可以查询是否导入成功,可能有很多key[root@abcdocker ~]# rpm -qa gpg-pubkey* gpg-pubkey-f4a80eb5-53a7ff4b gpg-pubkey-d88e42b4-52371eca
4.添加yum仓库[root@abcdocker ~]# cat /etc/yum.repos.d/logstash.repo [logstash-2.3] name=Logstash repository for 2.3.x packages baseurl=https://packages.elastic.co/logstash/2.3/centos gpgcheck=1 gpgkey=https://packages.elastic.co/GPG-KEY-elasticsearch enabled=1
5.安装logstash[root@abcdocker ~]# yum install -y logstash [root@abcdocker ~]# rpm -qa |grep logst logstash-2.3.4-1.noarch #请在2台服务器都进行安装
6. 配置logstash
提示:logstash实现input和ouput主要是依赖于logstash有需多的插件[root@abcdocker ~]# /opt/logstash/bin/logstash -e 'input { stdin{} } output { stdout{} }' OpenJDK 64-Bit Server VM warning: If the number of processors is expected to increase from one, then you should configure the number of parallel GC threads appropriately using -XX:ParallelGCThreads=N Settings: Default pipeline workers: 1 Pipeline main started www.abcdocker.com 2017-03-12T04:13:31.347Z abcdocker.com www.abcdocker.com input插件stdin(标准输入) output插件 stdout(标准输出) /opt/logstash/bin/logstash 前台启动 提示:标准输入和标准输出的意思就是我们输入什么就会输出什么 输入:www.abcdocker.com 输入:时间戳、节点名称、内容
使用codec rubydebug功能[root@abcdocker ~]# /opt/logstash/bin/logstash -e 'input { stdin{} } output { stdout{ codec => rubydebug} }' OpenJDK 64-Bit Server VM warning: If the number of processors is expected to increase from one, then you should configure the number of parallel GC threads appropriately using -XX:ParallelGCThreads=N Settings: Default pipeline workers: 1 Pipeline main started www.abcdocker.com { "message" => "www.abcdocker.com", #内容 "@version" => "1", #版本 "@timestamp" => "2017-03-12T04:18:06.702Z", #时间戳 "host" => "abcdocker.com" #主机 } => 代表等号 这样就可以让我们的输出内容显示的美观一些
7. 将日志写入es里面
官方文档地址:https://www.elastic.co/guide/en/logstash/current/first-event.html
INPUT插件:https://www.elastic.co/guide/en/logstash/current/input-plugins.html
OUTPUT插件:https://www.elastic.co/guide/en/logstash/current/output-plugins.html
我们将日志写入到es需要查看output插件,同样我们也可以INPUT es日志,OUTPUT es日志
写入到elasticsearch:
https://www.elastic.co/guide/en/logstash/current/plugins-outputs-elasticsearch.html配置主机及索引(生产场景都是写入配置文件中)
[root@abcdocker ~]# /opt/logstash/bin/logstash -e 'input { stdin{} } output { elasticsearch { hosts => ["192.168.56.11:9200"] index => "logstash-%{+YYYY.MM.dd}" } }' #使用output插件将数据写入es # hosts 定义主机名称 # index 定义日期格式 [root@abcdocker ~]# /opt/logstash/bin/logstash -e 'input { stdin{} } output { elasticsearch { hosts => ["192.168.56.11:9200"] index => "logstash-%{+YYYY.MM.dd}" } }' OpenJDK 64-Bit Server VM warning: If the number of processors is expected to increase from one, then you should configure the number of parallel GC threads appropriately using -XX:ParallelGCThreads=N Settings: Default pipeline workers: 1 Pipeline main started www.abcdocker.com --- time
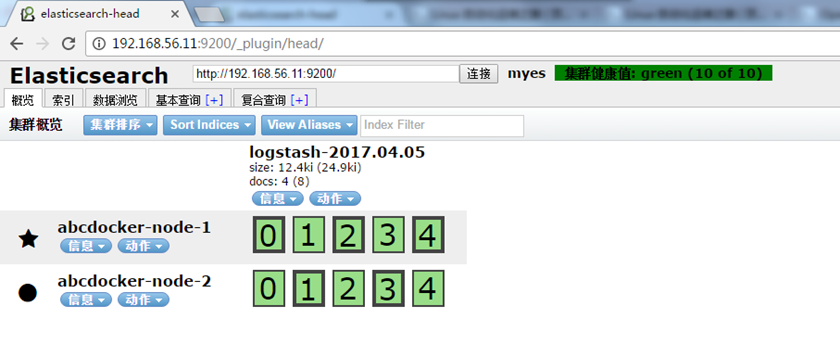
这时候信息已经不进行输出而是写入到ES中,我们可以到es上进行查看
访问地址: http://ip:9200/_plugin/head/
ES搭建文档:https://www.abcdocker.com/abcdocker/2234
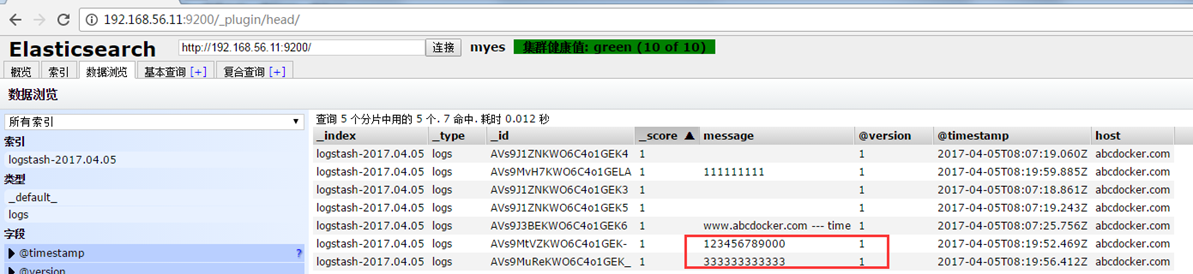
这样我们就可以看到我们输出的www.abcdocker.com ---time的信息,以及日志的时间等。我们写入完之后直接刷新就可以显示。
我们可以将信息打印到es里面,又进行输出[root@abcdocker ~]# /opt/logstash/bin/logstash -e 'input { stdin{} } output { stdout{ codec => rubydebug } elasticsearch { hosts => ["192.168.56.11:9200"] index => "logstash-%{+YYYY.MM.dd}" } }' OpenJDK 64-Bit Server VM warning: If the number of processors is expected to increase from one, then you should configure the number of parallel GC threads appropriately using -XX:ParallelGCThreads=N Settings: Default pipeline workers: 1 Pipeline main started 123456789000 3{ "message" => "123456789000", "@version" => "1", "@timestamp" => "2017-04-05T08:19:52.469Z", "host" => "abcdocker.com" } 33333333333 { "message" => "333333333333", "@version" => "1", "@timestamp" => "2017-04-05T08:19:56.412Z", "host" => "abcdocker.com" } 111111111 { "message" => "111111111", "@version" => "1", "@timestamp" => "2017-04-05T08:19:59.885Z", "host" => "abcdocker.com" }
提示:我们学习logstash需要灵活的运用本身的插件,来实现我们想要的任何的功能
我们现在把logstash放在前台运行,是为了更好的学习插件。现在我们需要把logstash运行在后台
提示:在收集的时候所有的机器都需要安装一个logstash(通过网络可以不需要)因为在INPUT和OUTPUT插件有一个通过http的插件,这样可以通过网络进行传输。如果是文件我所有的节点都需要安装一个logstash
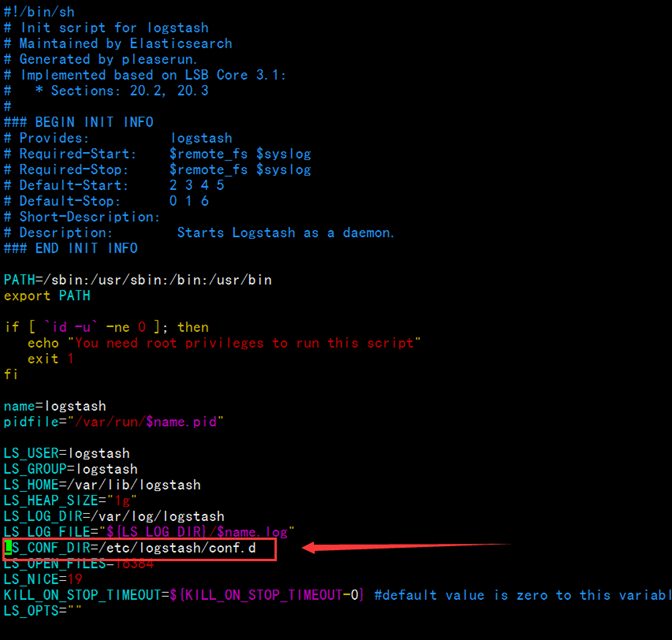
yum安装的目录需要将配置文件放在/etc/logstash/conf.d目录下,因为脚本会在这个目录进行读取[root@abcdocker ~]# vim /etc/init.d/logstash
脚本启动的时候会去这个目录下找配置文件
编写配置文件
我们进入/etc/logstash/conf.d下进行编辑配置文件[root@abcdocker ~]# cd /etc/logstash/conf.d/ [root@abcdocker conf.d]# cat demo.conf input{ stdin{} } filter{ } output{ elasticsearch { hosts => ["192.168.56.11:9200"] index => "logstash-%{+YYYY.MM.dd}" } stdout{ codec => rubydebug } } #配置文件的写法和命令行的区别并不大
配置文件小提示:
配置文件的语法需要包含INPUT or OUTPUT,其中filter可以没有。
INPUT和OUTPUT中的{}不可以搞错,其中INPUT存放INPUT插件,OUTPUT存放OUTPUT插件
(其中插件也需要有{花括号}) “=>”代表等于,写一个数组需要使用[中括号]多个可以使用逗号分隔。
字符串需要使用“双引号”
#号代表注释
日志中信息都是一行一行的,在logstash中叫做事件(因为logstash可以将多行进行合并)
流程: 事件 –> input –> codec –> filter –> codec –> output
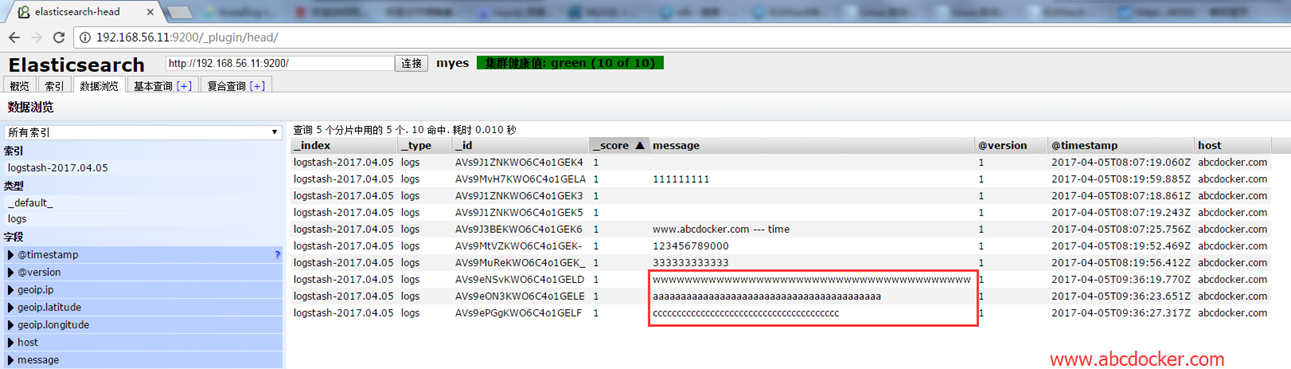
指定配置文件启动[root@abcdocker ~]# /opt/logstash/bin/logstash -f /etc/logstash/conf.d/demo.conf OpenJDK 64-Bit Server VM warning: If the number of processors is expected to increase from one, then you should configure the number of parallel GC threads appropriately using -XX:ParallelGCThreads=N Settings: Default pipeline workers: 1 Pipeline main started wwwwwwwwwwwwwwwwwwwwwwwwwwwwwwwwwwwwwwww { "message" => "wwwwwwwwwwwwwwwwwwwwwwwwwwwwwwwwwwwwwwww", "@version" => "1", "@timestamp" => "2017-04-05T09:36:19.770Z", "host" => "abcdocker.com" } aaaaaaaaaaaaaaaaaaaaaaaaaaaaaaaaaaaaaaaaa { "message" => "aaaaaaaaaaaaaaaaaaaaaaaaaaaaaaaaaaaaaaaaa", "@version" => "1", "@timestamp" => "2017-04-05T09:36:23.651Z", "host" => "abcdocker.com" } ccccccccccccccccccccccccccccccccccccccc { "message" => "ccccccccccccccccccccccccccccccccccccccc", "@version" => "1", "@timestamp" => "2017-04-05T09:36:27.317Z", "host" => "abcdocker.com" }
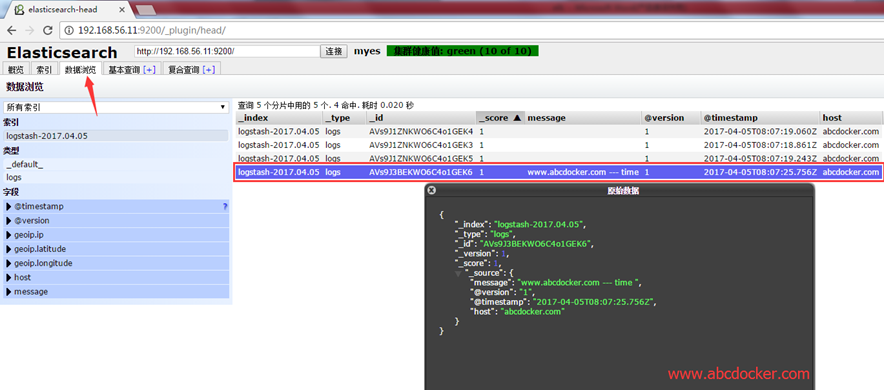
我们在查看head插件
这时候我们写的配置文件已经可以实现简单的输出和将数据写入ES中三、插件介绍
INPUT插件介绍
file插件地址:https://www.elastic.co/guide/en/logstash/current/plugins-inputs-file.html
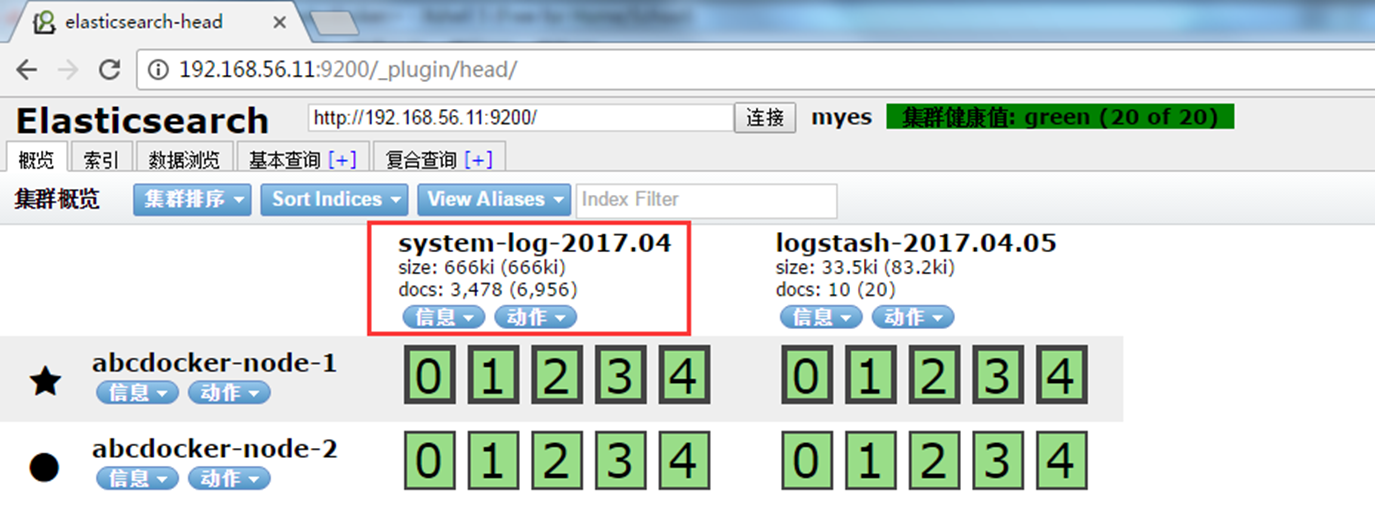
1.收集mesassage错误日志[root@abcdocker ~]# vim /etc/logstash/conf.d/file.conf input { file{ path => ["/var/log/messages","/var/log/secure"] type => "system-log" start_position => "beginning" } } filter{ } output{ elasticsearch { hosts => ["192.168.56.11:9200"] index => "system-log-%{+YYYY.MM}" } } path 定义日志路径 start_position 记录日志从头读取数据还是从尾读取数据 type 可以设置类型,进行if判断(简单来说可以将日志进行分类,错误放在一起,正常放在一起) 提示:关于hosts后面端口可写可不写,不写默认是9200 [root@abcdocker ~]# /opt/logstash/bin/logstash -f /etc/logstash/conf.d/file.conf 启动
我们可以访问head进行查看
基础介绍完毕


相关文章推荐
- Logstash学习系列之基础介绍
- ELKStack 基础介绍之 Kibana [四]
- 软件测试的基础知识概要介绍
- TCPIP完整的一套基础介绍
- SORC基础介绍
- 软件测试的基础知识概要介绍
- TCP/IP完整的一套基础介绍
- AOP技术介绍--(AOP技术基础)
- Unicode字符/字符串 之一 基础介绍
- 软件测试的基础知识概要介绍(转载)
- SOA基础教程介绍
- C#锐利体验 第二讲 C#语言基础介绍
- GIS基础知识——厂商介绍(一)MapInfo公司
- C#锐利体验之第二讲 C#语言基础介绍
- GIS基础知识——厂商介绍(二)ESRI公司
- DirectX 9高层着色语言介绍2 —— 语言基础(1)
- Linux服务器内核编译基础--几个重要的RedHat Linux内核文件介绍
- AJAX技术基础介绍
- AJAX技术基础介绍