phpstorm+xdebug+chrome helper配置php断点调试
2017-03-25 21:35
591 查看
一、首先下载对应php版本的xdebug的dll文件放入php的扩展目录ext目录里,在php.ini文件的末尾添加如下代码:
二、打开phpstorm,依次点击File>Settings>Languages&Frameworks>PHP,按如下步骤配置:
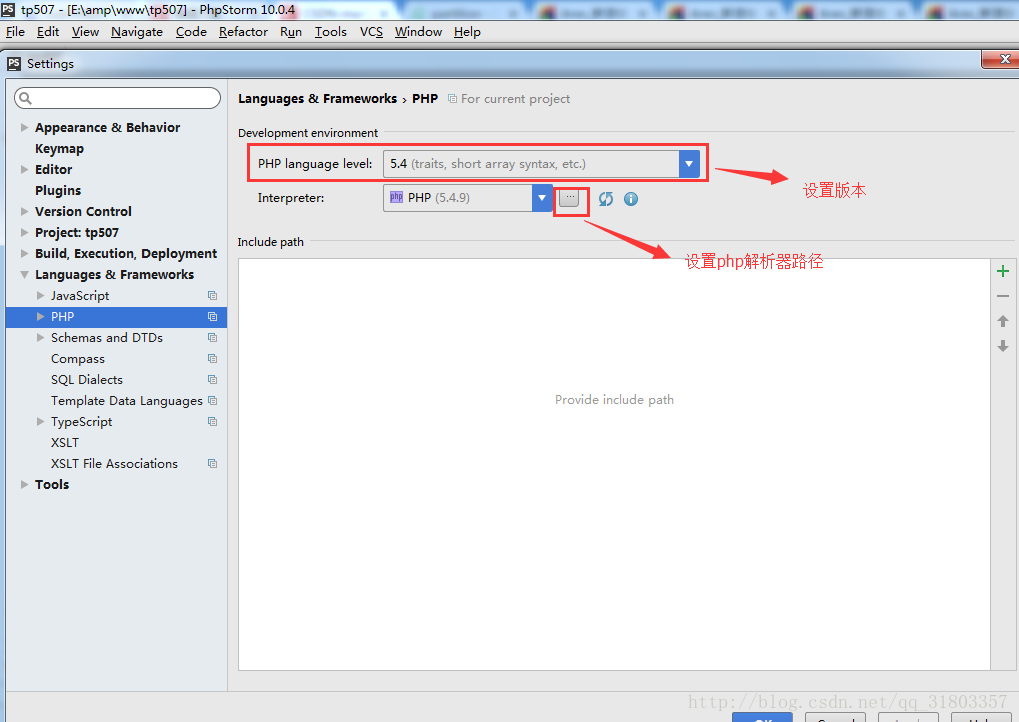
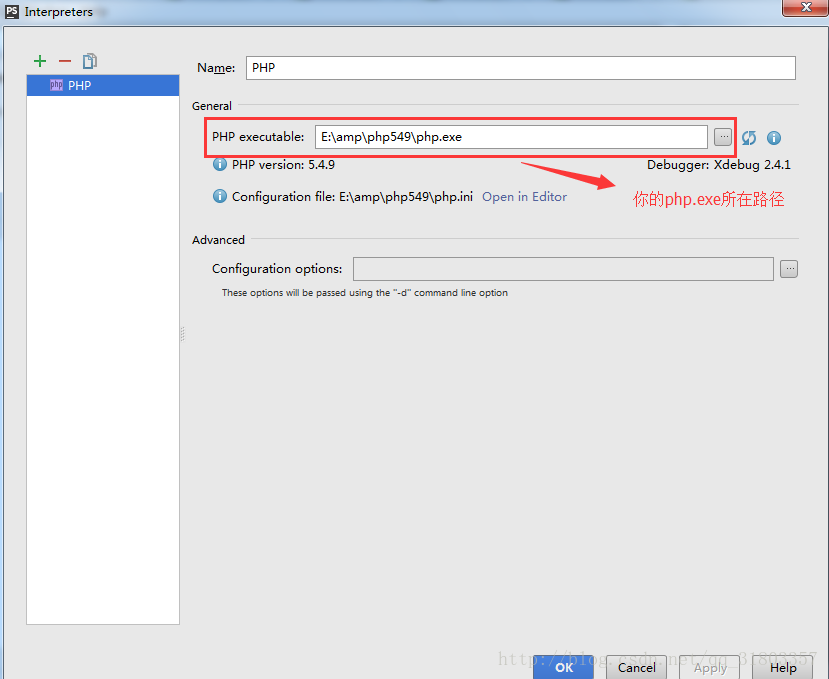
1、配置php版本和php解析器,如下图:
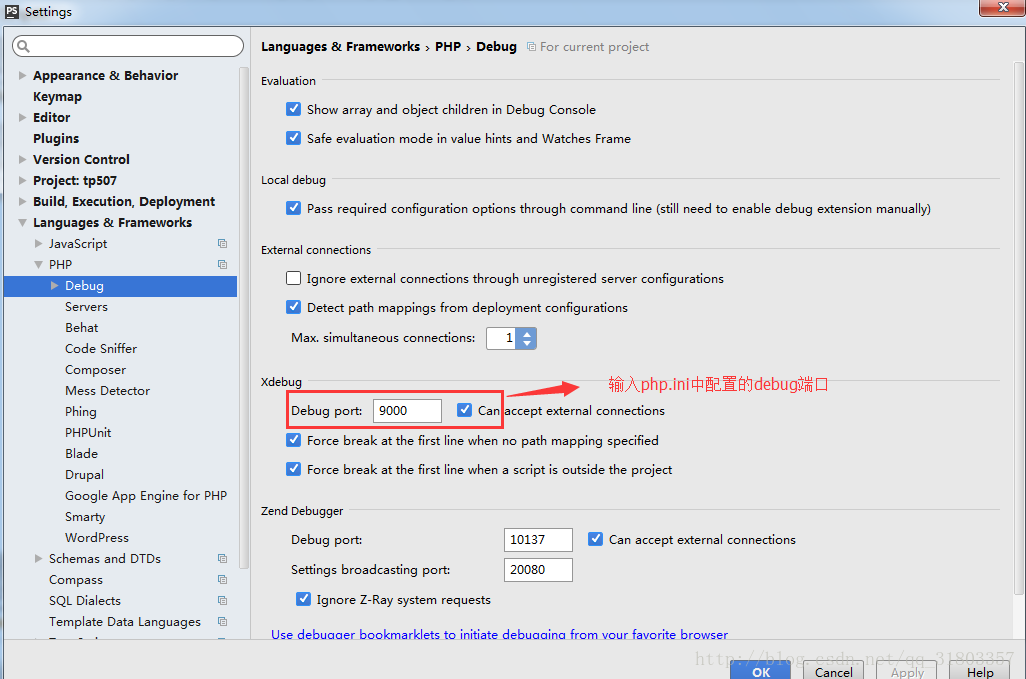
2、选择File>Settings>Languages&Frameworks>PHP>Debug,找到XDebug选项卡,Debug port 输入的是刚刚php.ini配置文件当中xdebug.remote_port的值如下图:
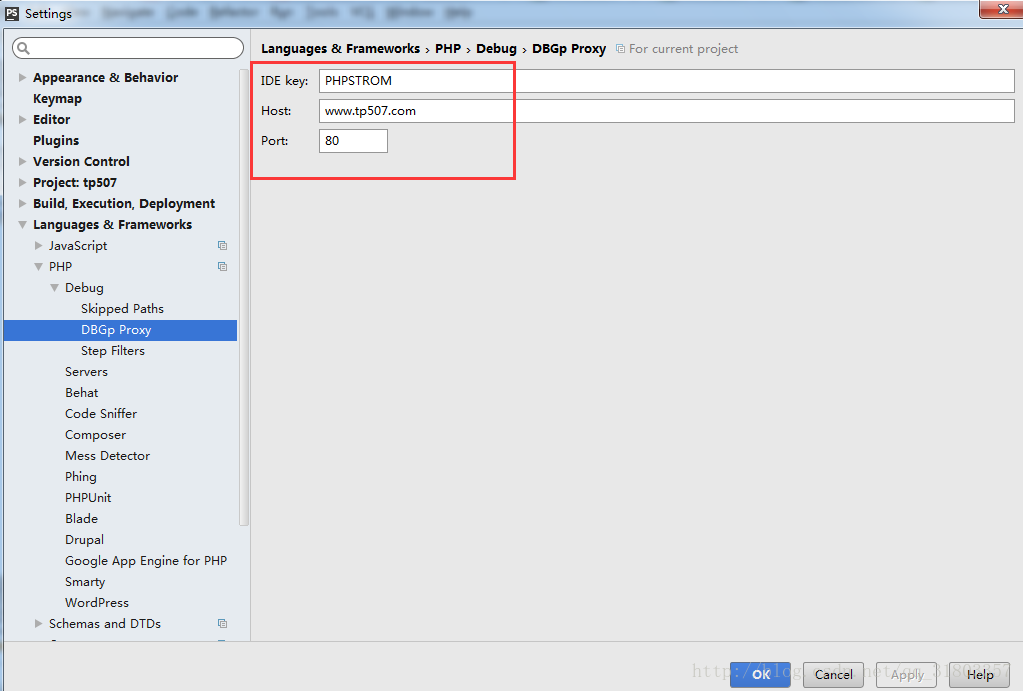
3、选择File>Settings>Languages&Frameworks>PHP>Debug>DBGp Proxy,
IED key输入刚刚php.ini文件中xdebug.idekey的值,Host、Port是File>Settings>Languages&Frameworks>PHP>Servers中设定的Host、Port值(后面设置,我设置的是我本地虚拟主机上的)。如下图:
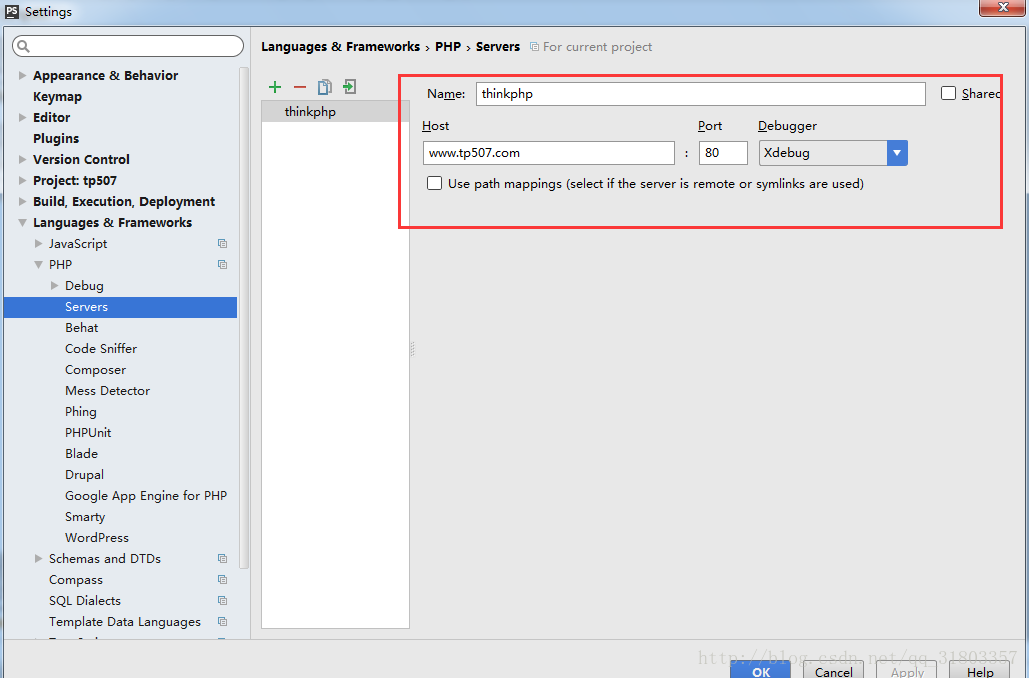
4、选择File>Settings>Languages&Frameworks>PHP>Servers,进行如下配置,注意对应前面DBGp Prox中设置的Host和Port的值,如下图:
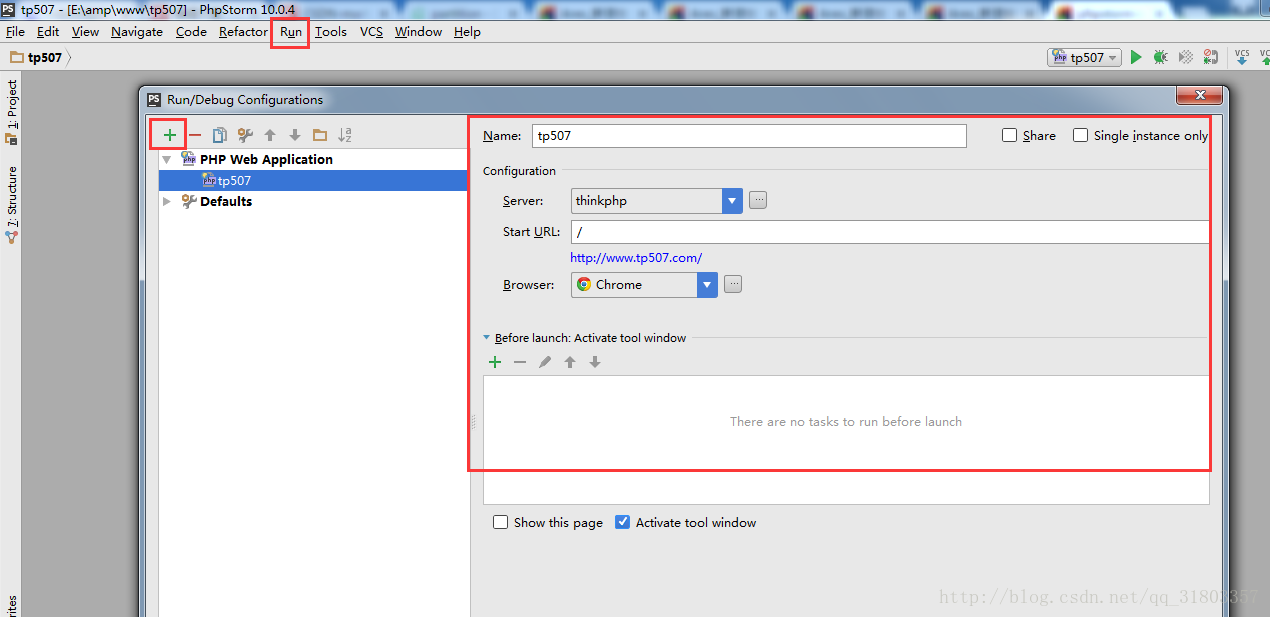
5、退出File后,依次点击菜单栏的Run>Edit Configurations…,在弹出的窗口中点击+号添加一个PHP Web Application,配置如下图:
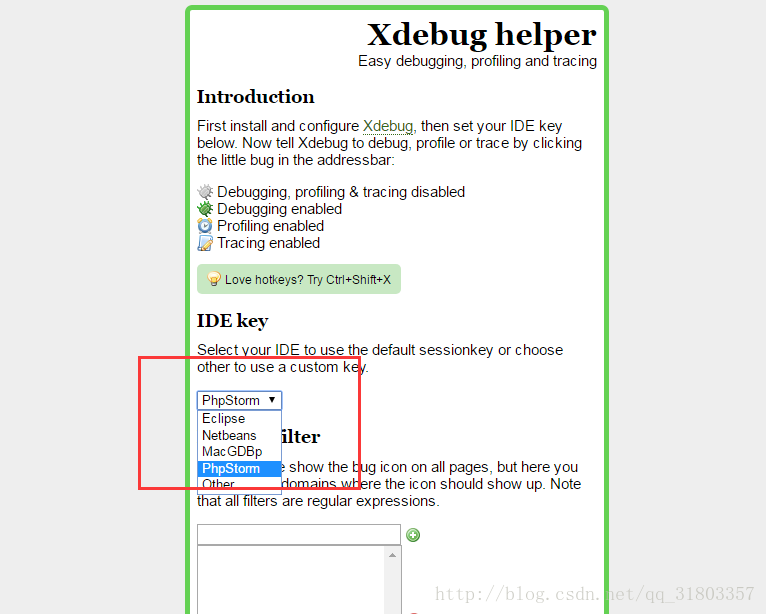
三、下载谷歌浏览器的扩展程序chrome helper,安装好后,在选项里找到IDE key,在其下拉列表中选择PhpStorm。如下图:
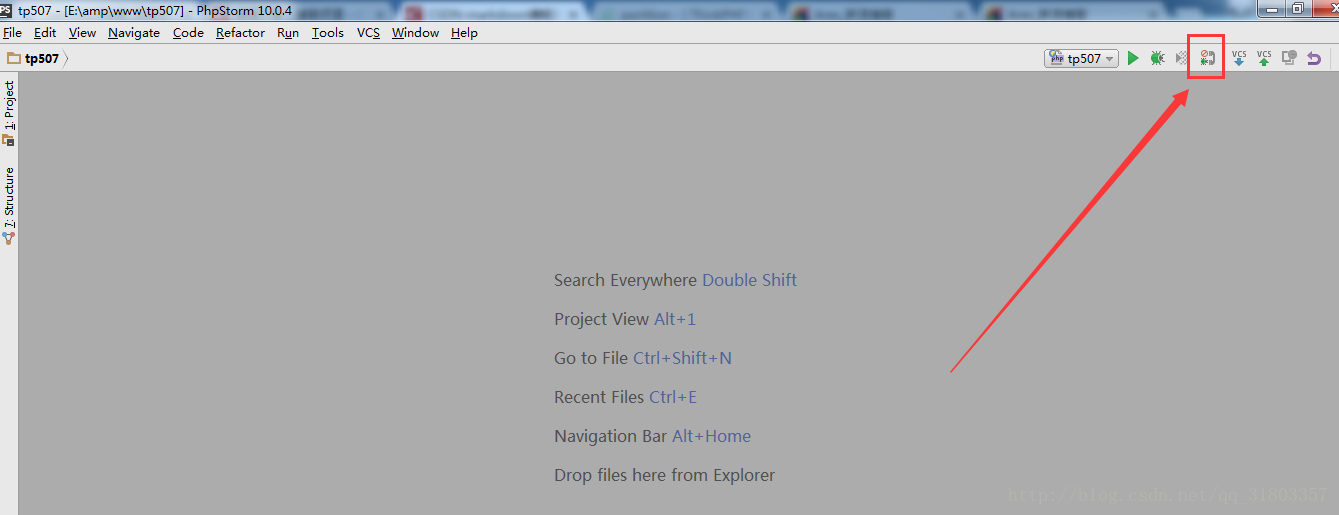
,接着点击灰色的chrome helper的臭虫图标,在下拉项中选择Debug项,这时臭虫图标变为绿色,处于调试模式。配置好后,打开phpstorm,点击下图中的电话按钮开启侦听浏览器。如下图所示:
最后,我们在测试文件中打上断点,然后在浏览器中输入打上断点后的文件的url地址就可以开启我们的xdebug调试之旅了。
[XDebug]
zend_extension = "E:/amp/php549/ext/php_xdebug-2.4.1-5.4-vc9.dll" ;载入Xdebug
xdebug.profiler_append = 0
xdebug.profiler_enable = 0  ;配置是否产生cachegrind.out.%t-%s文件,为0时不产生
xdebug.profiler_enable_trigger = 0
xdebug.profiler_output_dir = "E:/amp/tmp/xdebug" ;xdebug 的数据文件目录
xdebug.trace_output_dir = "E:/amp/tmp/xdebug"  ;xdebug 的数据文件目录
xdebug.profiler_output_name = "cachegrind.out.%t-%s"
xdebug.auto_trace = On ;开启自动跟踪
xdebug.show_exception_trace = On ;开启异常跟踪
xdebug.remote_enable = on ;开启远程调试
xdebug.remote_handler = "dbgp" ;用于zend studio远程调试的应用层通信协议
xdebug.remote_host = "127.0.0.1" ;允许连接的zend studio的IP地址
xdebug.remote_port = 9000 ;反向连接zend studio使用的端口
xdebug.remote_autostart = Off ;开启远程调试自动启动
xdebug.collect_vars = On ;收集变量
xdebug.collect_return = On ;收集返回值
xdebug.collect_params = On ;收集参数
xdebug.idekey= PHPSTROM
二、打开phpstorm,依次点击File>Settings>Languages&Frameworks>PHP,按如下步骤配置:
1、配置php版本和php解析器,如下图:
2、选择File>Settings>Languages&Frameworks>PHP>Debug,找到XDebug选项卡,Debug port 输入的是刚刚php.ini配置文件当中xdebug.remote_port的值如下图:
3、选择File>Settings>Languages&Frameworks>PHP>Debug>DBGp Proxy,
IED key输入刚刚php.ini文件中xdebug.idekey的值,Host、Port是File>Settings>Languages&Frameworks>PHP>Servers中设定的Host、Port值(后面设置,我设置的是我本地虚拟主机上的)。如下图:
4、选择File>Settings>Languages&Frameworks>PHP>Servers,进行如下配置,注意对应前面DBGp Prox中设置的Host和Port的值,如下图:
5、退出File后,依次点击菜单栏的Run>Edit Configurations…,在弹出的窗口中点击+号添加一个PHP Web Application,配置如下图:
三、下载谷歌浏览器的扩展程序chrome helper,安装好后,在选项里找到IDE key,在其下拉列表中选择PhpStorm。如下图:
,接着点击灰色的chrome helper的臭虫图标,在下拉项中选择Debug项,这时臭虫图标变为绿色,处于调试模式。配置好后,打开phpstorm,点击下图中的电话按钮开启侦听浏览器。如下图所示:
最后,我们在测试文件中打上断点,然后在浏览器中输入打上断点后的文件的url地址就可以开启我们的xdebug调试之旅了。

相关文章推荐
- 本地环境 XAMPP+phpStorm+XDebug+chrome 配置和断点调试
- PHPStorm + Homestead + Xdebug + Chrome Xdebug Helper 调试配置
- PHPStorm + Homestead + Xdebug + Chrome Xdebug Helper 调试配置
- 本地环境 XAMPP+phpStorm+XDebug+chrome 配置和断点调试
- 本地环境 XAMPP+phpStorm+XDebug+chrome 配置和断点调试
- PHPStorm + Xdebug + Chrome Xdebug Helper 调试配置
- 本地环境 XAMPP+phpStorm+XDebug+chrome 配置和断点调试
- 本地环境 XAMPP+phpStorm+XDebug+chrome 配置和断点调试
- 本地环境 XAMPP+phpStorm+XDebug+chrome 配置和断点调试
- 本地环境 XAMPP+phpStorm+XDebug+chrome配置和断点调试 注册方法
- 本地环境 XAMPP+phpStorm+XDebug+chrome 配置和断点调试
- 本地环境 XAMPP+phpStorm+XDebug+chrome配置和断点调试
- 本地环境 XAMPP+phpStorm+XDebug+chrome配置和断点调试
- 本地环境 XAMPP+phpStorm+XDebug+chrome配置和断点调试 注册方法
- 史上最佳 Mac+PhpStorm+XAMPP+Xdebug 集成开发和断点调试环境的配置
- XAMPP环境下用phpStorm+XDebug进行断点调试的配置
- 史上最佳 Mac+PhpStorm+XAMPP+Xdebug 集成开发和断点调试环境的配置
- phpStorm+XDebug进行断点调试的配置
- 史上最佳 Mac+PhpStorm+XAMPP+Xdebug 集成开发和断点调试环境的配置
- XAMPP环境下用phpStorm+XDebug进行断点调试的配置