matplotlib-在图表中显示中文
2017-01-17 13:03
495 查看
我使用的方法:
其中simsun.ttc需要另行下载
代码段:
# coding=utf-8
from matplotlib.font_manager import FontProperties
font = FontProperties(fname='/ly/simsun.ttc', size=14)
其中simsun.ttc需要另行下载
代码段:
# coding=utf-8
from matplotlib.font_manager import FontProperties
import pylab as pl
font = FontProperties(fname='/ly/simsun.ttc', size=14)
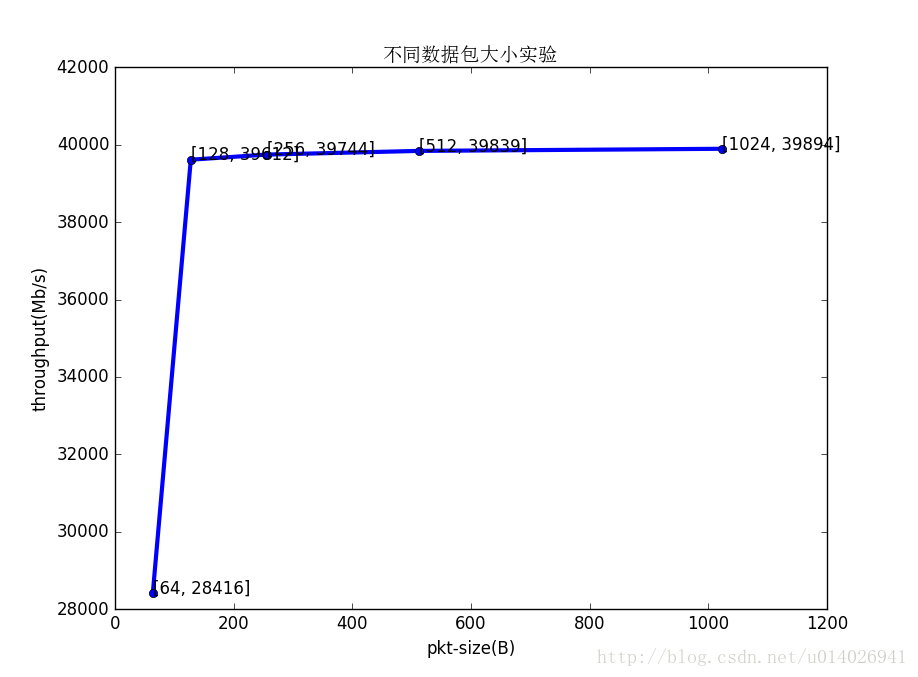
x1 = [64, 128, 256, 512, 1024]
y1 = [28416, 39612, 39744, 39839, 39894]
pl.plot(x1, y1, 'b', linewidth=3, marker='o')
pl.title(u'不同数据包大小实验', fontproperties=font)
pl.xlabel('pkt-size(B)')
pl.ylabel('throughput(Mb/s)')
for i in range(len(x1)):
pl.text(x1[i],y1[i],[x1[i],y1[i]])
pl.ylim(28000.0, 42000.0)
pl.show()

相关文章推荐
- 解决Matplotlib绘制的图表不能正确显示中文
- 在Python的matplotlib.pyplot图表中显示中文
- matplotlib图表中能够显示中文和负号
- python matplotlib.pyplot 显示中文title等参数
- 解决python27 matplotlib 中文不显示问题
- Win 10系统matplotlib中文无法显示的解决方案
- Linux环境下修改python matplotlib显示中文乱码方格
- Python 3下使用Matplotlib工具画图,中文显示乱码的问题解决(修改配置文件)
- python matplotlib plot 数据中的中文无法正常显示的解决办法
- PyCharm seaborn matplotlib 显示中文问题
- matplotlib命令与格式:系统字体与显示中文
- Ubuntu下用matplotlib作图时显示中文
- python matplotlib.plot画图显示中文乱码的问题
- 解决python27 matplotlib 中文不显示问题
- matplotlib显示中文问题
- 解决python中matplotlib绘图中文显示问题
- matplotlib pyplot 显示中文
- Python 中,matplotlib绘图无法显示中文的问题
- python matplotlib中文显示问题
- Python绘图问题:Matplotlib中如何正确显示中文