数据可视化matplotlib的应用(二)
2017-01-01 09:56
876 查看
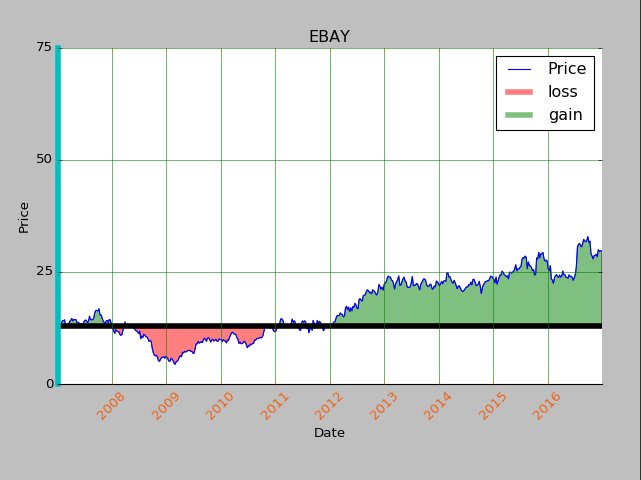
对边框和Horizontal 一些设置:
ax1.spines['left'].set_color('c') #将左边框栏设置c颜色
ax1.spines['right'].set_visible(False) #将右边框栏设置不可见
ax1.spines['top'].set_visible(False) #将上边框栏设置为不可见
ax1.spines['left'].set_linewidth(5) #将左边框栏的宽度设置为5
ax1.tick_params(axis='x', colors='#f06215') #将x轴的标签颜色设置成#f06215
ax1.axhline(closep[0], color='k', linewidth=5) #将Horizontal 就是横轴颜色设置K,宽度设置为5
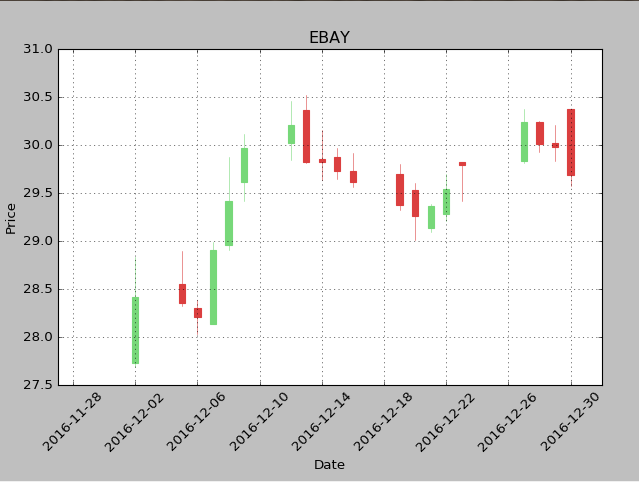
ohlc和candlestick的应用:
from matplotlib.ticker as mticker
from matplotlib.finance import candlestick_ohlc
x = 0
y = len(date)
ohlc = []
while x < y:
append_me = date[x], openp[x], highp[x], lowp[x], closep[x], volume[x]
ohlc.append(append_me)
x+=1
candlestick_ohlc(ax1, ohlc, width=0.4, colorup='#77d879', colordown='#db3f3f')
for label in ax1.xaxis.get_ticklabels():
label.set_rotation(45)
ax1.xaxis.set_major_formatter(mdates.DateFormatter('%Y-%m-%d'))
ax1.xaxis.set_major_locator(mticker.MaxNLocator(10))
ax1.grid(True)
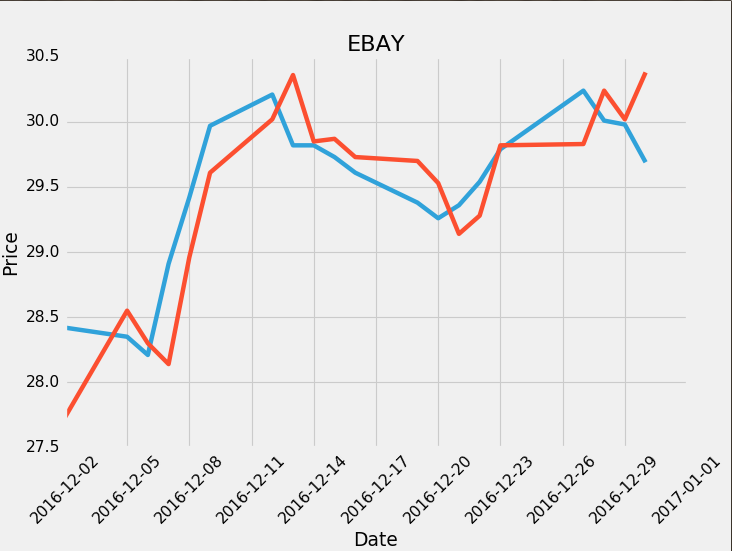
用style订制matplotlib
from matplotlib import style
style.use('ggplot')
style.use('fivethirtyeight')
ax1.plot(date,closep)
ax1.plot(date,openp)
#还可以使用的sytle如下:
#['seaborn-white', 'classic', 'seaborn-ticks', 'grayscale', 'seaborn-colorblind', 'ggplot', 'seaborn-dark', 'seaborn-darkgrid', 'seaborn-pastel', 'dark_background', 'seaborn-whitegrid', 'bmh',
'seaborn-dark-palette', 'seaborn-notebook', 'seaborn-bright', 'fivethirtyeight', 'seaborn-deep', 'seaborn-talk', 'seaborn-paper', 'seaborn-muted', 'seaborn-poster']
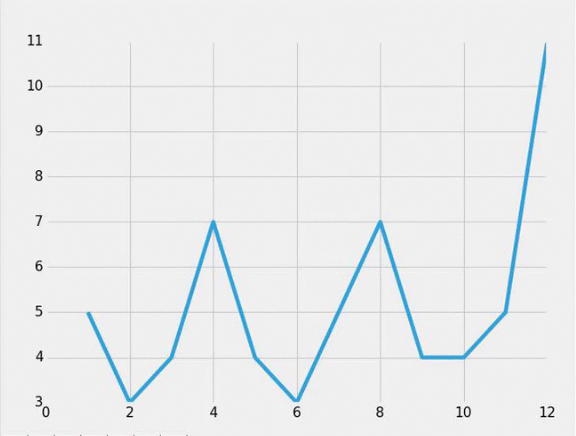
Animation的使用:
import matplotlib.pyplot as plt
import matplotlib.animation as animation
from matplotlib import style
style.use('fivethirtyeight')
fig = plt.figure()
ax1 = fig.add_subplot(1,1,1)
def animate(i):
graph_data = open('kk.txt','r').read()
lines = graph_data.split('\n')
xs = []
ys = []
for line in lines:
if len(line) >1:
x, y = line.split(',')
xs.append(x)
ys.append(y)
ax1.clear()
ax1.plot(xs, ys)
ani = animation.FuncAnimation(fig, animate, interval=1000)
plt.show()
ax1.spines['left'].set_color('c') #将左边框栏设置c颜色
ax1.spines['right'].set_visible(False) #将右边框栏设置不可见
ax1.spines['top'].set_visible(False) #将上边框栏设置为不可见
ax1.spines['left'].set_linewidth(5) #将左边框栏的宽度设置为5
ax1.tick_params(axis='x', colors='#f06215') #将x轴的标签颜色设置成#f06215
ax1.axhline(closep[0], color='k', linewidth=5) #将Horizontal 就是横轴颜色设置K,宽度设置为5
ohlc和candlestick的应用:
from matplotlib.ticker as mticker
from matplotlib.finance import candlestick_ohlc
x = 0
y = len(date)
ohlc = []
while x < y:
append_me = date[x], openp[x], highp[x], lowp[x], closep[x], volume[x]
ohlc.append(append_me)
x+=1
candlestick_ohlc(ax1, ohlc, width=0.4, colorup='#77d879', colordown='#db3f3f')
for label in ax1.xaxis.get_ticklabels():
label.set_rotation(45)
ax1.xaxis.set_major_formatter(mdates.DateFormatter('%Y-%m-%d'))
ax1.xaxis.set_major_locator(mticker.MaxNLocator(10))
ax1.grid(True)
用style订制matplotlib
from matplotlib import style
style.use('ggplot')
style.use('fivethirtyeight')
ax1.plot(date,closep)
ax1.plot(date,openp)
#还可以使用的sytle如下:
#['seaborn-white', 'classic', 'seaborn-ticks', 'grayscale', 'seaborn-colorblind', 'ggplot', 'seaborn-dark', 'seaborn-darkgrid', 'seaborn-pastel', 'dark_background', 'seaborn-whitegrid', 'bmh',
'seaborn-dark-palette', 'seaborn-notebook', 'seaborn-bright', 'fivethirtyeight', 'seaborn-deep', 'seaborn-talk', 'seaborn-paper', 'seaborn-muted', 'seaborn-poster']
Animation的使用:
import matplotlib.pyplot as plt
import matplotlib.animation as animation
from matplotlib import style
style.use('fivethirtyeight')
fig = plt.figure()
ax1 = fig.add_subplot(1,1,1)
def animate(i):
graph_data = open('kk.txt','r').read()
lines = graph_data.split('\n')
xs = []
ys = []
for line in lines:
if len(line) >1:
x, y = line.split(',')
xs.append(x)
ys.append(y)
ax1.clear()
ax1.plot(xs, ys)
ani = animation.FuncAnimation(fig, animate, interval=1000)
plt.show()

相关文章推荐
- 数据可视化matplotlib的应用(三)
- 数据可视化matplotlib的应用
- 数据可视化matplotlib的应用(四)
- 数据可视化-Python之Matplotlib
- Python数据可视化图像库MatPlotLib基本图像操作
- Python进阶(四十)-数据可视化の使用matplotlib进行绘图
- Python进阶(三十九)-数据可视化の使用matplotlib进行绘图分析数据
- 【Matplotlib】数据可视化实例分析
- TensotFlow 应用实例:06-使用matplotlib可视化训练过程
- python——数据可视化:matplotlib,seaborn,pandas
- Python科学计算数据可视化模块-Matplotlib
- Python数据可视化:Matplotlib 直方图、箱线图、条形图、热图、折线图、散点图。。。
- matplotlib数据可视化入门-python
- python数据挖掘课程 十一.Pandas、Matplotlib结合SQL语句可视化分析
- 压力测试监控数据通过python matplotlib进行可视化
- 数据分析-文件中CSV分析和matplotlib的一些应用
- python中数据分析数据可视化作图matplotlib
- 数据可视化——matplotlib.pyplot
- 【Python数据分析】四级成绩分布 -matplotlib,xlrd 应用
- python的数据可视化库 matplotlib 和 pyecharts