Kubernetes监控——Heapster+InfluxDB+Grafana
2016-11-25 14:45
1356 查看
Kubernetes & Docker监控之最后一章,前三篇如下:
1、kubernetes+docker监控之简介
2、 kubernetes+docker监控之Docker监控——cadvisor
3、 Docker监控——Cadvisor+InfluxDB+Grafana搭建过程
[b][b](2)、heapster单独作为容器启动:[/b][/b]
参数说明:
heapster容器,启动过程:
看到influxdb已经有k8s的数据库和表了,剩下的就是grafana搜索和显示了
请参考之前Cadvisor+InfluxDB+Grafana的内容,http://my.oschina.net/fufangchun/blog/718382
[b][b](2)、Grafana配置:[/b][/b]
[b]Ⅰ、配置influxdb数据源:[/b]
[b]Ⅱ、新建展示页:[/b]
展示页,用来区分不同的influxdb数据源

[b]Ⅲ、新建数据项:[/b]
根据特定的条件(sql),从influxdb查询相关的数据,并展示。
Grafana会自动显示k8s库的字段,可以根据需求进行选择,每个where后面,加上:【pod_name =~ /^\.*/】,按照pod名称分类


[b]Ⅳ、完整的grafana展示:[/b]
这里上传可能看不清,可以去百度盘下载,我这里是有些数据是分别做了,按照pod和namespace进行分组的,有多租户的情况,比较实用,可以根据情况,自行定义。
百度盘地址: http://pan.baidu.com/s/1qXQIqPA
Kubernetes & Docker监控 ,至此完结,欢迎分享讨论!!!
1、kubernetes+docker监控之简介
2、 kubernetes+docker监控之Docker监控——cadvisor
3、 Docker监控——Cadvisor+InfluxDB+Grafana搭建过程
[b]1)、heapster下载和启动:[/b]
[b][b](1)、heapster镜像下载:[/b][/b]| docker pull index.tenxcloud.com/google_containers/heapster:v1.1.0 |
| docker run -d index.tenxcloud.com/google_containers/heapster:v1.1.0 "--source=kubernetes:http://192.168.16.100:8080?inClusterConfig=false&kubeletHttps=true&kubeletPort=10250&useServiceAccount=true&auth=" "--sink=influxdb:http://192.168.16.234:8086" |
| --source :指定kube-apiserver,这里使用https,需要注意下 --sink :指定influxdb,heapster自动创建数据库【k8s】 inClusterConfig :Use kube config in service accounts associated with heapster's namesapce. (default: true) kubeletPort :kubelet port to use (default: 10255) kubeletHttps : whether to use https to connect to kubelets (default: false) apiVersion : API version to use to talk to Kubernetes. Defaults to the version in kubeConfig. insecure :whether to trust kubernetes certificates (default: false) auth :client auth file to use. Set auth if the service accounts are not usable. useServiceAccount :whether to use the service account token if one is mounted at /var/run/secrets/kubernetes.io/serviceaccount/token (default: false) |
| [root@localhost kube-1.2]# docker run -d index.tenxcloud.com/google_containers/heapster:v1.1.0 "--source=kubernetes:http://192.168.16.100:8080?inClusterConfig=false&kubeletHttps=true&kubeletPort=10250&useServiceAccount=true&auth=" "--sink=influxdb:http://192.168.16.234:8086" b86aaaaa88ccf648120611254bfeb0078a8b9dd853d4b5a2d6a0abb97743bf1d [root@localhost kube-1.2]# docker logs b86aaaaa8 I0714 07:05:18.116787 1 heapster.go:65] /heapster --source=kubernetes:http://192.168.16.100:8080?inClusterConfig=false&kubeletHttps=true&kubeletPort=10250&useServiceAccount=true&auth= --sink=influxdb:http://192.168.16.234:8086 I0714 07:05:18.117158 1 heapster.go:66] Heapster version 1.1.0 I0714 07:05:18.239220 1 configs.go:60] Using Kubernetes client with master "http://192.168.16.100:8080" and version "v1" I0714 07:05:18.239270 1 configs.go:61] Using kubelet port 10250 I0714 07:05:31.255132 1 influxdb.go:223] created influxdb sink with options: host:192.168.16.234:8086 user:root db:k8s I0714 07:05:31.255170 1 heapster.go:92] Starting with InfluxDB Sink I0714 07:05:31.255177 1 heapster.go:92] Starting with Metric Sink I0714 07:05:31.271159 1 heapster.go:171] Starting heapster on port 8082 I0714 07:06:05.000403 1 manager.go:79] Scraping metrics start: 2016-07-14 07:05:00 +0000 UTC, end: 2016-07-14 07:06:00 +0000 UTC E0714 07:06:05.000504 1 kubelet.go:270] No nodes received from APIserver. I0714 07:06:05.000520 1 manager.go:152] ScrapeMetrics: time: 5.756µs size: 0 I0714 07:06:05.365486 1 influxdb.go:201] Created database "k8s" on influxDB server at "192.168.16.234:8086" [root@localhost kube-1.2]# [root@localhost kube-1.2]# docker ps |grep heapster b86aaaaa88cc index.tenxcloud.com/google_containers/heapster:v1.1.0 "/heapster --source=k" 2 minutes ago Up 2 minutes furious_mahavira [root@localhost kube-1.2]# |
| [root@localhost kube-1.2]# influx Visit https://enterprise.influxdata.com to register for updates, InfluxDB server management, and monitoring. Connected to http://localhost:8086 version 0.9.6 InfluxDB shell 0.9.6 > > > show databases name: databases --------------- name _internal cadvisor k8s > > use k8s Using database k8s > > SHOW MEASUREMENTS name: measurements ------------------ name cpu/node_reservation cpu/node_utilization cpu/usage cpu/usage_rate filesystem/limit filesystem/usage memory/major_page_faults memory/major_page_faults_rate memory/node_reservation memory/node_utilization memory/page_faults memory/page_faults_rate memory/usage memory/working_set network/rx network/rx_errors network/rx_errors_rate network/rx_rate network/tx network/tx_errors network/tx_errors_rate network/tx_rate uptime |
[b]2)、InfluxDB安装与配置:[/b]
请参考之前Cadvisor+InfluxDB+Grafana的内容,http://my.oschina.net/fufangchun/blog/718382[b]3)、Grafana安装与配置:[/b]
[b][b](1)、Grafana安装:[/b][/b]请参考之前Cadvisor+InfluxDB+Grafana的内容,http://my.oschina.net/fufangchun/blog/718382
[b][b](2)、Grafana配置:[/b][/b]
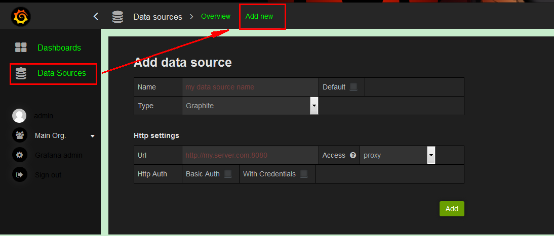
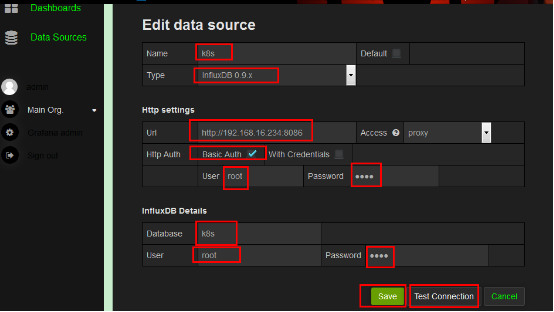
[b]Ⅰ、配置influxdb数据源:[/b]
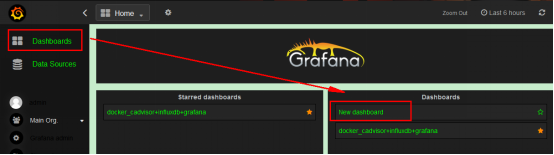
[b]Ⅱ、新建展示页:[/b]
展示页,用来区分不同的influxdb数据源
[b]Ⅲ、新建数据项:[/b]
根据特定的条件(sql),从influxdb查询相关的数据,并展示。
Grafana会自动显示k8s库的字段,可以根据需求进行选择,每个where后面,加上:【pod_name =~ /^\.*/】,按照pod名称分类
| SELECT last(value) FROM k8s."default"."network/tx" WHERE pod_name =~ /^\.*/ AND time > now() - 30m GROUP BY time(10s), pod_name |
[b]Ⅳ、完整的grafana展示:[/b]
这里上传可能看不清,可以去百度盘下载,我这里是有些数据是分别做了,按照pod和namespace进行分组的,有多租户的情况,比较实用,可以根据情况,自行定义。
百度盘地址: http://pan.baidu.com/s/1qXQIqPA
Kubernetes & Docker监控 ,至此完结,欢迎分享讨论!!!

相关文章推荐
- Kubernetes监控:部署Heapster、InfluxDB和Grafana
- kubernetes学习记录(10)——建立Heapster+Influxdb+Grafana集群性能监控平台
- kubernetes安装heapster、influxdb及grafana
- <总结> 部署 Kubernetes+Heapster+InfluxDB+Grafana 详解
- [工具开发] 分享两个基于Heapster 和 Influxdb 的 Grafana 监控仪表盘模板
- collectd, influxdb, grafana协同作战,不一样的监控
- .Net Core 2.0+ InfluxDB+Grafana+App Metrics 实现跨平台的实时性能监控
- Windows下本机简易监控系统搭建(Telegraf+Influxdb+Grafana)
- StatsD+InfluxDB+Grafana 打造应用性能监控平台--01背景知识
- grafana + influxdb + telegraf , 构建性能监控平台
- telegraf+influxdb+grafana+spring boot构建监控平台
- 使用 Grafana、collectd 和 InfluxDB 打造现代监控系统
- 使用 StatsD + InfluxDB + Grafana 搭建 Node.js 监控系统 (二)
- 使用 Grafana+collectd+InfluxDB 打造现代监控系统 2015年03月19日 | 标签: collectd, grafana, influxdb | 作者:vpsee 想打造
- influxdb+grafana搭建业务监控平台前篇-相关环境搭建
- 利用Metrics+influxdb+grafana构建监控平台
- collectd+logstash+influxdb+grafana构建windows服务器应用监控系统
- Windows下本机简易监控系统搭建(Telegraf+Influxdb+Grafana)
- Spring boot Actuator配合Jolokia,Telegraf,Influxdb,Grafana实现监控
- 基于InfluxDB&Grafana的JMeter实时性能测试数据的监控和展示