Python 实现决策树 ID3 C4.5 悲观剪枝
2016-10-01 20:34
525 查看
#!/usr/bin/python
# -*- coding: utf-8 -*-
import math
import random
import operator

'''
zys 2016-10-01
本程序实现的是C4.5(包含ID3的实现)
参考: http://blog.csdn.net/lulei1217/article/details/49583357 过程:
1、创建决策树
1)通过计算增量熵查找第一个最优特征分类
2)根据分类的特征如(0,1)分别去除掉数据中已经确定的分类数据
3)通过计算新数据增量熵查找下一个最优特征
4)返回导第二步骤,直到符合循环终止条件
条件一:其当前分类特征全部相同
条件二:所有特征都已经分类
2、进行悲观剪枝
3、使用决策树进行测试分类
'''

def createTree(traindata, labels):
'''创建决策树'''
classList = [item[-1] for item in traindata]
'''
当前特征分类的labels全部相同的时候停止分类,直接返回任意一个label
例如:当badrecord(不良记录) = 1时候,offer全部都为0 这时候直接返回0
'''
if classList.count(classList[0]) == len(classList):
return classList[0]
if len(traindata[0]) == 1:
return majorityCnt(classList)
bestFeature = chooseBestFeature(traindata)  # 获取最优分类特征
bestFeatLabel = labels[bestFeature]
tree = {bestFeatLabel: {}}
featureList = [example[bestFeature] for example in traindata]
uniqueVals = set(featureList)
''''
循环对后续特征分类
去除掉已经选择的特征和数据
'''
del(labels[bestFeature])
for feature in uniqueVals:
A = getLablesByfeature(traindata, bestFeature, feature)
tree[bestFeatLabel][feature] = createTree(A, labels[:])
return tree

def majorityCnt(classList):
'''当对最后一个特征进行分类时候,直接返回当前出现最多的labels'''
classCount = {}
for vote in classList:
classCount[vote] = classCount.get(vote, 0) + 1
# key=operator.itemgetter(1) 定义函数key,获取对象的第1个域的值
sortedClassCount = sorted(classCount.items(),
key=operator.itemgetter(1), reverse=True)
return sortedClassCount[0][0]

def chooseBestFeature(traindata):
'''
选择最优特征
在ID3中获取信息熵的增益:Gain(S,A) = Entropy(S) - ∑(|A| / |S|) * Entropy(A)
在C4.5中获取的是信息熵的增益率:
SplitInfo(A) = - ∑(|A| / |S|) * log2(|A| / |S|)
GainRate(S,A) = Gain(S,A) / SplitInfo(A)
Entropy(S) 指总集合S的信息信息熵
A 是S中的某个属性的子集
|S| 指集合S的样例数data
'''
size = len(traindata[0]) - 1   # 获取特征的数量
Entropy = calculateEntropy(traindata)  # 计算总集合的信息熵 Entropy(S)
GainRate = 0.0
bestFeature = -1
for i in range(size):
'''
获取当前特征的子集,例如:
school 对应着[0,0,0,0,1,1,1,1]
'''
featureList = [example[i] for example in traindata]
'''
获取当前特征的分类,例如
school 对应着[0,1] 名校、不是名校
'''
uniqueVals = set(featureList)
newEntropy = 0.0
splitInfo = 0.0
for feature in uniqueVals:
A = getLablesByfeature(traindata, i, feature)
prob = float(len(A)) / len(traindata)
# 计算特征子集的信息熵 Entropy(A)
newEntropy += prob * calculateEntropy(A)
info = 0.0
if(prob != 0):
info = math.log(prob, 2)
splitInfo -= prob * info
newGain = Entropy - newEntropy  # 计算信息增益
if (splitInfo == 0):  # 修复溢出错误
splitinfo = -0.99 * math.log(0.99, 2) - 0.01 * math.log(0.01, 2)
newGain = newGain / splitInfo
if (newGain > GainRate):
GainRate = newGain
bestFeature = i
return bestFeature

'''
ID3 中的代码:
def chooseBestFeature(traindata):
size = len(traindata[0]) - 1
Entropy = calculateEntropy(traindata)
Gain = 0.0
bestFeature = -1
for i in range(size):
uniqueVals = set(featureList)
newEntropy = 0.0
for feature in uniqueVals:
A = getLablesByfeature(traindata, i, feature)
prob = float(len(A)) / len(traindata)
newEntropy += prob * calculateEntropy(A)
newGain = Entropy - newEntropy
if (newGain > Gain):
Gain = newGain
bestFeature = i
return bestFeature
'''

def getLablesByfeature(traindata, index, feature):
'''
通过特征来获取对应的Lables,例如:
获取school=0,多对应的Lables [0,0,1,0]
'''
A = []
for item in traindata:
if item[index] == feature:
temp = item[:index]  # 抽取除index特征外的所有的记录的内容
temp.extend(item[index + 1:])
A.append(temp)
return A

def calculateEntropy(data):
'''
计算信息熵 Entropy=-∑P(ui)*log(P(ui))
P(ui)是类别ui出现概率
'''
labelCount = {}
for item <
4000
span class="hljs-keyword">in data:
lable = item[-1]
labelCount[lable] = labelCount.get(lable, 0) + 1
entropy = 0.0
for key in labelCount:
p = float(labelCount[key]) / len(data)
entropy -= p * math.log(p, 2)
return entropy

def classify(tree, lables, item):
'''
测试
tree.keys()找出所有的key,在获取对应的key值时候需要将其改变为list类型
'''
root = list(tree.keys())[0]
nextNode = tree[root]
index = lables.index(root)
key = item[index]
val = nextNode[key]
'''
判断valueOfFeat是否是dict类型
如果是说明其还有子节
不是则表示没有子节点,返回的值就是其对应的分类
'''
if(isinstance(val, dict)):
classLabel = classify(val, lables, item)
else:
classLabel = val
return classLabel

def getCount(tree, data, lables, count):
root = list(tree.keys())[0]
nextNode = tree[root]
index = lables.index(root)
del(lables[index])
for key in nextNode.keys():
rightcount = 0
wrongcount = 0
A = getLablesByfeature(data, index, key)
# 判断是否是叶子节点,不是则迭代进入下一层
if(isinstance(nextNode[key], dict)):
getCount(nextNode[key], A, lables[:], count)
else:
for item in A:
# 判断数组给定的分类是否与叶子节点的值相同
if(str(item[-1]) == str(nextNode[key])):
rightcount += 1
else:
wrongcount += 1
count.append([rightcount, wrongcount])

def cutBranch(tree, data, lables):
'''
悲观剪枝 参考:http://www.jianshu.com/p/794d08199e5e
old = errorNum + o.5 * L  errorNum:叶子节点错误分类的个数,L:叶子节点个数
p = old / N  N:数据样本总个数
new = errorNum + o.5
S = math.sqrt(N  * p * (1 - p))
if new <= old - S then 剪枝

注:都是自己理解的,如果有不对的地方欢迎指出
'''
root = list(tree.keys())[0]
nextNode = tree[root]
index = lables.index(root)
newTree = {root: {}}
del(lables[index])
for key in nextNode.keys():
# 如果子节点不是叶子节点就判断其是否满足剪枝
if(isinstance(nextNode[key], dict)):
A = getLablesByfeature(data, index, key)
count = []
# 获取每个叶子节点的(正确分类数,错误分类数)
getCount(nextNode[key], A, lables[:], count)
allnum = 0
errornum = 0
for i in count:
allnum += i[0] + i[1]
errornum += i[1]
if(errornum == 0):
# 当该子树不存在错误分类的时候,不对该树进行剪枝操作
# 进行下个循环
newTree[root][key] = nextNode[key]
continue
old = errornum + len(count) * 0.5
new = errornum + 0.5
p = old / allnum
S = math.sqrt(allnum * p * (1 - p))
if(new <= old - S):
# 用当前分类时出现最多的lables代替该子树
classList = [item[-1] for item in A]
newTree[root][key] = majorityCnt(classList)
else:
# 不满足剪枝则进入其子树内部继续进行剪枝操作
newTree[root][key] = cutBranch(nextNode[key], A, lables[:])
else:
newTree[root][key] = nextNode[key]
return newTree

if(__name__ == "__main__"):
'''
-----------------------------开始-----------------------------
公司校园招聘
名校    技术能力    不良记录    是否录取
是(1)   厉害(1)     有(1)      录取(1)
否(0)   一般(0)     无(0)      不录取(0)

data = [[0, 0, 0, 0],
[0, 0, 1, 0],
[0, 1, 0, 1],
[0, 1, 1, 0],
[1, 0, 0, 1],
[1, 0, 1, 0],
[1, 1, 0, 1],
[1, 1, 1, 0]]
lables = ["school", "ability", "badrecord", "offer"]
'''
# data = [['youth', 'high', 'no', 'fair', 'no'],
#         ['youth', 'high', 'no', 'excellent', 'no'],
#         ['middle_aged', 'high', 'no', 'fair', 'yes'],
#         ['senior', 'medium', 'no', 'fair', 'yes'],
#         ['senior', 'low', 'yes', 'fair', 'yes'],
#         ['senior', 'low', 'yes', 'excellent', 'no'],
#         ['middle_aged', 'low', 'yes', 'excellent', 'yes'],
#         ['youth', 'medium', 'no', 'fair', 'no'],
#         ['youth', 'low', 'yes', 'fair', 'yes'],
#         ['senior', 'medium', 'yes', 'fair', 'yes'],
#         ['youth', 'medium', 'yes', 'excellent', 'yes'],
#         ['middle_aged', 'medium', 'no', 'excellent', 'yes'],
#         ['middle_aged', 'high', 'yes', 'fair', 'yes'],
#         ['senior', 'medium', 'no', 'excellent', 'no']]
# lables = ['age', 'income', 'student', 'credit_rating']
data = [['dark_green', 'curl_up', 'little_heavily', 'distinct', 'sinking', 'hard_smooth', 1],
['black', 'curl_up', 'heavily', 'distinct', 'sinking', 'hard_smooth', 1],
['black', 'curl_up', 'little_heavily',
'distinct', 'sinking', 'hard_smooth', 1],
['dark_green', 'little_curl_up', 'little_heavily',
'distinct', 'little_sinking', 'soft_stick', 1],
['black', 'little_curl_up', 'little_heavily',
'little_blur', 'little_sinking', 'soft_stick', 1],
['dark_green', 'stiff', 'clear', 'distinct', 'even', 'soft_stick', 0],
['light_white', 'little_curl_up', 'heavily',
'little_blur', 'sinking', 'hard_smooth', 0],
['black', 'little_curl_up', 'little_heavily',
'distinct', 'little_sinking', 'soft_stick', 0],
['light_white', 'curl_up', 'little_heavily',
'blur', 'even', 'hard_smooth', 0],
['dark_green', 'curl_up', 'heavily', 'little_blur',
'little_sinking', 'hard_smooth', 0],
['dark_green', 'curl_up', 'heavily',
'distinct', 'sinking', 'hard_smooth', 1],
['light_white', 'curl_up', 'little_heavily',
'distinct', 'sinking', 'hard_smooth', 1],
['black', 'little_curl_up', 'little_heavily',
'distinct', 'little_sinking', 'hard_smooth', 1],
['black', 'little_curl_up', 'heavily', 'little_blur',
'little_sinking', 'hard_smooth', 0],
['light_white', 'stiff', 'clear', 'blur', 'even', 'hard_smooth', 0],
['light_white', 'curl_up', 'little_heavily',
'blur', 'even', 'soft_stick', 0],
['dark_green', 'little_curl_up', 'little_heavily', 'little_blur', 'sinking', 'hard_smooth', 0]]
lables = ['color', 'root', 'knocks', 'texture', 'navel', 'touch']

'''
传入的是data和lables的复制,因为在函数中会改变该值。
而python传参传递的是一个地址,因此会改变原本的数据
'''
decisiontree = createTree(data[:], lables[:])
createPlot(decisiontree)
decisiontree = cutBranch(decisiontree, data, lables[:])
k = 0
for item in data:
if(classify(decisiontree, lables[:], item) == item[-1]):
k += 1
print(float(k) / len(data))
createPlot(decisiontree)
使用matplotlib画出决策树
import matplotlib.pyplot as plt

'''
使用matplotlib的annotate画出决策树
参考: http://matplotlib.org/api/pyplot_api.html#matplotlib.pyplot.annotate matplotlib.pyplot.annotate(text,xy,xytext,xycoords,textcoords,arrowprops)
text:注解的内容
xy:箭头指向的坐标
xytext:注解内容的坐标,如果没有默认xy
xycoords:给定xy一个坐标系统
textcoords:给定xytext一个坐标系统
arrowprops:箭头的格式
'''
decisionNode = dict(boxstyle="round4", color='#3366FF')  # 定义判断结点形态
leafNode = dict(boxstyle="circle", color='#FF6633')  # 定义叶结点形态
arrow_args = dict(arrowstyle="<-", color='g')  # 定义箭头

# 绘制带箭头的注释
def plotNode(nodeTxt, centerPt, parentPt, nodeType):
cr
c715
eatePlot.ax1.annotate(nodeTxt, xy=parentPt, xycoords='axes fraction',
xytext=centerPt, textcoords='axes fraction',
va="center", ha="center", bbox=nodeType, arrowprops=arrow_args)

# 计算叶结点数
def getNumLeafs(myTree):
numLeafs = 0
firstStr = list(myTree.keys())[0]
secondDict = myTree[firstStr]
for key in secondDict.keys():
if type(secondDict[key]).__name__ == 'dict':
numLeafs += getNumLeafs(secondDict[key])
else:
numLeafs += 1
return numLeafs

# 计算树的层数
def getTreeDepth(myTree):
maxDepth = 0
firstStr = list(myTree.keys())[0]
secondDict = myTree[firstStr]
for key in secondDict.keys():
if type(secondDict[key]).__name__ == 'dict':
thisDepth = 1 + getTreeDepth(secondDict[key])
else:
thisDepth = 1
if thisDepth > maxDepth:
maxDepth = thisDepth
return maxDepth

# 在父子结点间填充文本信息相同
def plotMidText(cntrPt, parentPt, txtString):
xMid = (parentPt[0] - cntrPt[0]) / 2.0 + cntrPt[0]
yMid = (parentPt[1] - cntrPt[1]) / 2.0 + cntrPt[1]
createPlot.ax1.text(xMid, yMid, txtString, va="center",
ha="center", rotation=30)

def plotTree(myTree, parentPt, nodeTxt):
numLeafs = getNumLeafs(myTree)
depth = getTreeDepth(myTree)
firstStr = list(myTree.keys())[0]
cntrPt = (plotTree.xOff + (1.0 + float(numLeafs)) /
2.0 / plotTree.totalW, plotTree.yOff)
plotMidText(cntrPt, parentPt, nodeTxt)  # 在父子结点间填充文本信息
plotNode(firstStr, cntrPt, parentPt, decisionNode)  # 绘制带箭头的注释
secondDict = myTree[firstStr]
plotTree.yOff = plotTree.yOff - 1.0 / plotTree.totalD
for key in secondDict.keys():
if type(secondDict[key]).__name__ == 'dict':
plotTree(secondDict[key], cntrPt, str(key))
else:
plotTree.xOff = plotTree.xOff + 1.0 / plotTree.totalW
plotNode(secondDict[key], (plotTree.xOff,
plotTree.yOff), cntrPt, leafNode)
plotMidText((plotTree.xOff, plotTree.yOff), cntrPt, str(key))
plotTree.yOff = plotTree.yOff + 1.0 / plotTree.totalD

def createPlot(inTree):
fig = plt.figure(1, facecolor='white')
fig.clf()
axprops = dict(xticks=[], yticks=[])
createPlot.ax1 = plt.subplot(111, frameon=False, **axprops)
plotTree.totalW = float(getNumLeafs(inTree))
plotTree.totalD = float(getTreeDepth(inTree))
plotTree.xOff = -0.5 / plotTree.totalW
plotTree.yOff = 1.0
plotTree(inTree, (0.5, 1.0), '')
plt.show()
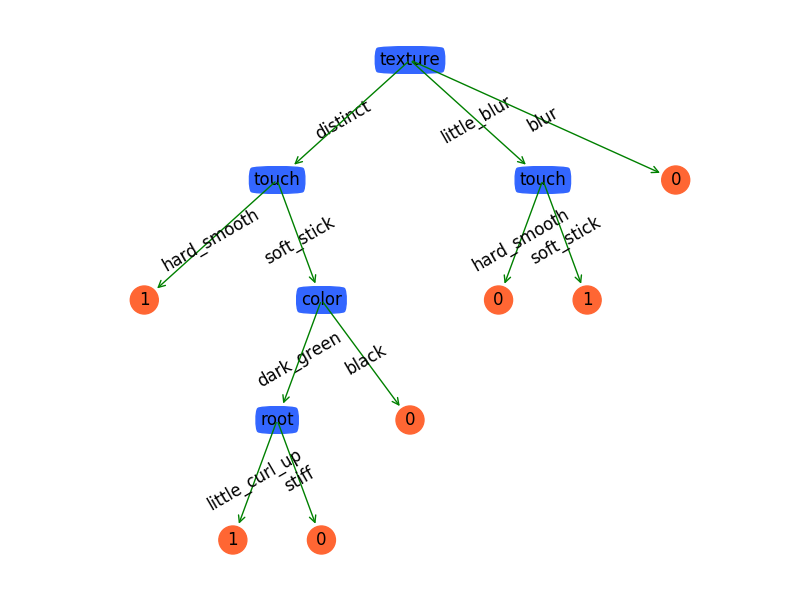
效果图

相关文章推荐
- 机器学习算法的Python实现 (3):CART决策树与剪枝处理
- Python实现决策树(ID3、C4.5)
- 决策树 (Decision Tree) 进阶应用 CART剪枝方法及Python实现方式
- 决策树ID3;C4.5详解和python实现与R语言实现比较
- 【Python学习系列十一】Python实现决策树实现C4.5(信息增益率)
- 机器学习算法的Python实现 (3):CART决策树与剪枝处理
- [置顶] 《统计学习方法》 决策树 ID3和C4.5 生成算法 Python实现
- 决策树剪枝简单python实现
- ID3 决策树 Python实现
- 决策树(ID3,C4.5)Python实现
- 用python实现c4.5算法,并进行悲观剪枝
- 【机器学习算法-python实现】决策树-Decision tree(1) 信息熵划分数据集
- 决策树的python实现方法
- Twitter的分布式自增ID算法Snowflake实现分析及其Java、Php和Python版
- 【机器学习算法-python实现】Adaboost的实现(1)-单层决策树(decision stump)
- 决策树的python实现方法
- 【机器学习算法-python实现】决策树-Decision tree(2) 决策树的实现
- 【机器学习】决策树-ID3算法的Python实现
- 【机器学习算法-python实现】决策树-Decision tree(1) 信息熵划分数据集
- 通过python调用adb命令实现用元素名称、id、class定位元素