How to debug .NET Core RC2 app with Visual Studio Code on Windows?
2016-05-26 08:57
609 查看
Simone Chiaretta (http://codeclimber.net.nz/archive/2016/05/20/How-to-debug-NET-Core-RC2-app-with-Visual-Studio.aspx)
So, you installed .NET Core RC2 , you followed the getting started tutorial and you got your “Hello World!” printed on your command prompt just by using the CLI. Then you went the next step and you tried to use Visual Studio Code and the C# extension to edit the application outside of Visual Studio. And finally you want to try and debug and set a breakpoint inside the application, but you encountered some problems and nothing worked. Here is how to make it work.
Then you must specify the path to your executable in the program property. In the standard hwapp sample app, replace
with
There is much more you can specify in the launch.json file. To see all the options have a look at the official doc: Debugging in Visual Studio Code.
In order to be able to debug cross-platform, .NET Core has now a “portable PDB” format, and the newly introduced .NET Core debugger for Visual Studio Code only supports this format. Unfortunately by default, on Windows, the .NET Core build generates standard “Windows PDBs”, which are not supported. But the fix is easy, you just have to tell the compiler to generate portable PDBs.
This is done by specifying the debugType to be portable.
And voila! Breakpoints are hit!
So, you installed .NET Core RC2 , you followed the getting started tutorial and you got your “Hello World!” printed on your command prompt just by using the CLI. Then you went the next step and you tried to use Visual Studio Code and the C# extension to edit the application outside of Visual Studio. And finally you want to try and debug and set a breakpoint inside the application, but you encountered some problems and nothing worked. Here is how to make it work.
Specify the launch configuration
Visual Studio Code needs to know how to launch your application, and this is specified in alaunch.json file inside the .vscode folder. From the debug window, click the “gear” icon and Code will create it for you: just choose the right environment “.NET Core”.Then you must specify the path to your executable in the program property. In the standard hwapp sample app, replace
[code] "program": "${workspaceRoot}/bin/Debug/<target-framework>/<project-name.dll>",with
[code] "program": "${workspaceRoot}/bin/Debug/netcoreapp1.0/hwapp.dll",There is much more you can specify in the launch.json file. To see all the options have a look at the official doc: Debugging in Visual Studio Code.
Specify the task runner
If you try to debug now you’ll have another warning: “No task runner configured”.This is because for launching, VS Code has to build the project, and this is done via a task. But no worries, just click the “Configure Task Runner” button in the info box, choose which task runner you want to use, in this case “.NET Core”, and the tasks.json file will be created for you. More info on task runners in VS Code can be found on the offical documentation: Tasks in Visual Studio Code.Running and debugging
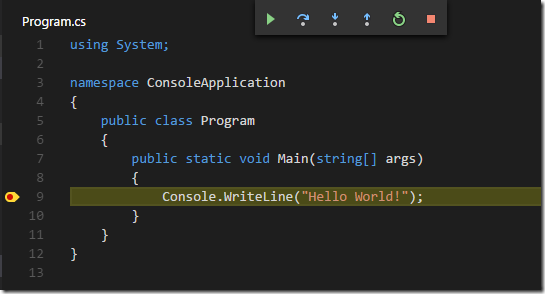
Now you can click the “Start Debugging” button or F5 and the application runs. Cool… Now you set a breakpoint and the executions stops where you set it, doesn’t it? Well… if you are on Mac or Linux it does. But it doesn’t stop if you are on Windows and the Debug Console says something like:[code] WARNING: Could not load symbols for 'hwapp.dll'.
'...\hwapp\bin\Debug\netcoreapp1.0\hwapp.pdb' is a Windows PDB.
These are not supported by the cross-platform .NET Core debugger.
Introducing Portable PDBs
In order to be able to debug cross-platform, .NET Core has now a “portable PDB” format, and the newly introduced .NET Core debugger for Visual Studio Code only supports this format. Unfortunately by default, on Windows, the .NET Core build generates standard “Windows PDBs”, which are not supported. But the fix is easy, you just have to tell the compiler to generate portable PDBs.This is done by specifying the debugType to be portable.
[code] {"buildOptions": {"debugType": "portable"
},
...
}
And voila! Breakpoints are hit!

相关文章推荐
- Android界面View及ViewGroup
- (4.1.5.4)App内广播LocalBroadcastManager局部通知管理器
- 移动端canvas.arc与css的filter
- Unity热门插件推荐
- Android Volley框架的使用
- android getView理解
- iOS/Android/Web Url Encode空格处理
- TypeError: 'str' object is not callable
- Android 探究 LayoutInflater setFactory
- ImageSwitcher和HorizontalScrollView实现相册
- Android EditText控件即设置最小高度又运行高度随内容增加而变化
- 详解swift和OC以及C语言的混编(不看后悔!)
- iostat详解
- WKWebView 与UIWebview 对比讲解
- merge中写的属性不起作用
- 疯狂连连看学习心得-基于Android Studio 2.0
- Android Service最全面的解析
- VS APP怎样在控制台程序下使用CString
- IIS负载均衡-Application Request Route详解第四篇:使用ARR实现三层部署架构
- 使用ListActivity优化功能