chrome浏览器下的xdebug helper使用方法
2016-05-17 23:07
316 查看
chrome浏览器下的xdebug helper使用方法
作者:稚子 时间:2014-04-10 分类:BS架构后台语言 Web前台开发技术 评论:0条 浏览:3560自从安装了xdebug后,发现每次调试都需要从eclipse中先从头启动,然后一步步走到你要调试的页面,而不是说想什么时候调试就什么时候调试。
之前用zenddebugger的时候则是可以在任意页面启动调试,直接从浏览器通知开发环境需要调试。而不用先从开发环境启动调试。随时需要调试的时候就可以执行调试。
后来发现了chrome浏览器有一款插件叫xdebug helper,火狐下也有easy xdebug,下面主要来说chrome下的xdebug helper
安装完成xdebug helper后再浏览器地址栏的右侧能够看到一只小爬虫,点击后如下图所示:
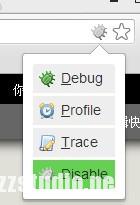
选择Debug,就会通知你的开发环境接下来的代码需要开始调试,选择disable,就会直接运行。
在eclipse中需要进行特别的设置:
进入window->Preferences->PHP->Debug
找到配置xdebug中的Accept remote session(JIT),选择为localhost,并保存。
在PHP的配置文件中对xdebug的设置需要特别注意,将xdebug.remote_autostart设置为off,如果设置为on,则会忽略在浏览器中是选择Debug还是Disable,都会通知eclipse进行调试
xdebug.remote_autostart = Off
这样,xdebug helper就设置好了
以下是我的php.ini中对xdebug的配置
| 1 2 3 4 5 6 7 8 9 10 11 12 13 14 15 16 | [Xdebug] ;xdebug配置 zend_extension="e:/php/ext/php_xdebug-2.2.1-5.4-vc9.dll" ;载入Xdebug xdebug.profiler_enable=on xdebug.trace_output_dir="e:/xdebug-log" ;xdebug 的数据文件目录 xdebug.profiler_output_dir="e:/xdebug-log" ;xdebug 的数据文件目录 xdebug.auto_trace = On ;开启自动跟踪 xdebug.show_exception_trace = On ;开启异常跟踪 xdebug.remote_autostart = Off ;开启远程调试自动启动 xdebug.remote_enable = On ;开启远程调试 xdebug.remote_handler=dbgp ;用于zend studio远程调试的应用层通信协议 xdebug.remote_host=127.0.0.1 ;允许连接的zend studio的IP地址 xdebug.remote_port=9000 ;反向连接zend studio使用的端口 xdebug.collect_vars = On ;收集变量 xdebug.collect_return = On ;收集返回值 xdebug.collect_params = On ;收集参数 xdebugbug.max_nesting_level = 10000 ;如果设得太小,函数中有递归调用自身次数太多时会报超过最大嵌套数错 |

相关文章推荐
- 简单的python爬取网页字符串内容并保存
- (难)POJ-3666 sort预处理+DP
- Java Collection Framework 之 ArrayList 源码解析
- springMVC运行流程分析
- 设计模式之装饰设和代理设计模式
- python一些内建函数(map,zip,filter,reduce,yield等)
- 多周期CPU设计
- 产品思维学习(六)--浅谈产品数据分析
- 保持进程
- iOS收到推送后,跳转到某一页面
- 新手学习java一分钟了解Java核心技术
- Direct3D中 SetStreamSource 函数与数据流
- Markdown的使用简介
- LINUX SHELL控制结构while
- 软件项目开发流程图
- poj1273完全不懂为何过的dinic最大流模板
- android笔记(3)
- Android 侧滑面板的实现(DragLayout)
- GLSL学习资料整理
- 《jQuery从入门到精通》第一节 为什么要学习jQuery