Matplotlib: Stacked Bar Graphs
2016-04-05 17:08
681 查看
我在用matplotlib's
stacked bar graph example 做bar统计图的时候,发现画出的图不能够准确匹配该项的值,几番查找原因,最终在Stack
Overflow上找到了答案。以下给出一个 Stacked Bar Graphs demo。
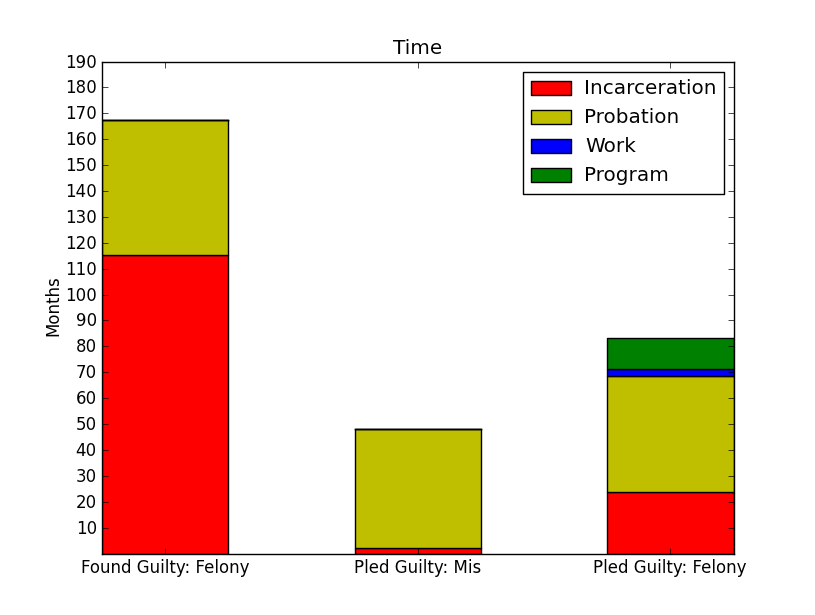
import numpy as np
import matplotlib.pyplot as plt
N = 3
#('PledMis', 'PledFel', 'FoundFel')
Incarceration = np.array([115.3, 1.99,23.7] )
Probation = np.array([52.0, 45.9, 45.0])
Work = np.array([0, 0.3, 2.4])
Program= np.array([0, 0, 12])
ind = np.arange(N) # the x locations for the groups
width = 0.5 # the width of the bars: can also be len(x) sequence
p1 = plt.bar(ind, Incarceration, width, color='r')
p2 = plt.bar(ind, Probation, width, color='y',bottom=Incarceration)
p3 = plt.bar(ind, Work, width, color='b',bottom= Probation+Incarceration)
p4 = plt.bar(ind, Program, width, color='g',bottom=Work+Probation+Incarceration)
plt.ylabel('Months')
plt.title('Time')
plt.xticks(ind+width/2, ('Found Guilty: Felony', 'Pled Guilty: Mis', 'Pled Guilty: Felony' ) )
plt.yticks(np.arange(10,200,10))
plt.legend ((p1[0], p2[0], p3[0], p4[0]), ('Incarceration', 'Probation','Work','Program' ))
plt.show()
图示结果:
如果我们做多个bar并且想要将之堆积起来,更有效的办法是用一个循环并且定义一个bottom自变量,代码如下:
colors = ('r', 'y', 'b', 'g')
data = (Incarceration, Probation, Work, Program)
bottom = np.zeros(N)
for elem, color in zip(data, colors):
plt.bar(ind, elem, width, bottom=bottom, color=color)
bottom += elem
stacked bar graph example 做bar统计图的时候,发现画出的图不能够准确匹配该项的值,几番查找原因,最终在Stack
Overflow上找到了答案。以下给出一个 Stacked Bar Graphs demo。
import numpy as np
import matplotlib.pyplot as plt
N = 3
#('PledMis', 'PledFel', 'FoundFel')
Incarceration = np.array([115.3, 1.99,23.7] )
Probation = np.array([52.0, 45.9, 45.0])
Work = np.array([0, 0.3, 2.4])
Program= np.array([0, 0, 12])
ind = np.arange(N) # the x locations for the groups
width = 0.5 # the width of the bars: can also be len(x) sequence
p1 = plt.bar(ind, Incarceration, width, color='r')
p2 = plt.bar(ind, Probation, width, color='y',bottom=Incarceration)
p3 = plt.bar(ind, Work, width, color='b',bottom= Probation+Incarceration)
p4 = plt.bar(ind, Program, width, color='g',bottom=Work+Probation+Incarceration)
plt.ylabel('Months')
plt.title('Time')
plt.xticks(ind+width/2, ('Found Guilty: Felony', 'Pled Guilty: Mis', 'Pled Guilty: Felony' ) )
plt.yticks(np.arange(10,200,10))
plt.legend ((p1[0], p2[0], p3[0], p4[0]), ('Incarceration', 'Probation','Work','Program' ))
plt.show()
图示结果:
如果我们做多个bar并且想要将之堆积起来,更有效的办法是用一个循环并且定义一个bottom自变量,代码如下:
colors = ('r', 'y', 'b', 'g')
data = (Incarceration, Probation, Work, Program)
bottom = np.zeros(N)
for elem, color in zip(data, colors):
plt.bar(ind, elem, width, bottom=bottom, color=color)
bottom += elem

相关文章推荐
- 使用PHP QR Code生成二维码
- PHP的db.inc.php(dao层的工作)
- PHP之文件
- win2008- 運行php
- render\forward\redirect区别
- php and js to facebook登陆 最佳实践
- phpstorm快捷键
- php实现用三元运算符求三个数中的最大值,最小值
- Thinkphp验证码异步验证第二次及以后验证,验证错误----待解决
- yii2 window下安装 不用composer
- 神器phpstorm功能详解
- PHP学习必看的一些书
- Laravel 5.2 使用ckeditor 及 ckfinder
- laravel中使用apidoc
- <php>Ajax基本格式
- 水平分表与垂直分表
- thinkPHP3.2.3集成swoole扩展
- php连接数据库
- php中的PHP_EOL换行符
- wifidog用php实现验证流程