Applying the Haar Wavelet Transform to Time Series Information
2015-12-30 12:39
656 查看
Applying the Haar Wavelet Transform to Time Series Information
| Contents |
|---|
| Introduction |
| What a long, strange trips its been |
| The wavelet technique for analyzing a signal or time series |
| The Language of Wavelets |
| Applying Wavelets and Java Source Code |
| Financial Time Series |
| Why Haar Wavelets? |
| Haar Wavelets |
| Filtering Spectrum |
| Noise Filters |
| Wavelets vs. Simple Filters |
| Limitations of the Haar Wavelet Transform |
| Wavelets and Parallelism |
| Java Source Code Download |
| Resources |
| References, Books |
| References, Web published |
| Links to sub-pages |
|---|
| Daubechies Wavelets |
| Filtering Using Haar Wavelets |
| The Haar Wavelet Transform and Noise Filters |
| Wavelet Noise Thresholding |
| Wavelets vs. Simple Filters |
| Wavelets in Java (includes histogramming and simple statistical algorithms) |
Introduction
This was the first web page I wrote on Wavelets. From this seed grew other web pages which discuss a variety of wavelet related topics. For a "table of contents" seeWaveletsand Signal Processing. This web page applies the wavelet transform to a time series composed of stock market close prices. Later web pages expand on this work in a variety of areas (e.g., compression, spectral analysis and forecasting).
When I started out I thought that I would implement the Haar wavelet and that some of my colleagues might find it useful. I did not expect signal processing to be such an interesting topic. Nor did I understand who many different areas of computer science,
mathematics, and quantitative finance would be touched by wavelets. I kept finding that "one thing lead to another", making it difficult to find a logical stopping place. This wandering path of discovery on my part also accounts for the somewhat organic growth
of these web pages. I have tried to tame this growth and organize it, but I fear that it still reflects the fact that I did not know where I was going when I started.
The Java code published along with this web page reflect the first work I did on wavelets. More sophisticated, lifting scheme based, algorithms, implemented in Java can be found on other web pages. The wavelet lifting scheme code, published on other web pages,
is simpler and easier to understand. The wavelet lifting scheme also provides an elegant and powerful framework for implementing a range of wavelet algorithms.
In implementing wavelet packet algorithms, I switched from Java to C++. The wavelet packet algorithm I used is simpler and more elegant using C++'s operator overloading features. C++ also supports generic data structures (templates), which allowed me to implement
a generic class hierarchy for wavelets. This code includes several different wavelet algoriths, including Haar, linear interpolation and Daubechies D4.
Like the wavelet algorithms, the financial modeling done here represents very early work. When I started working on these web pages I had no experience with modeling financial time series. The work described on this web page lead to more intensive experiments
with wavelet filters in financial models, which I continue to work on. On this web page I use stock market close prices. In financial modeling one usually uses returns, since what you are trying to predict is future return.
I became interested in wavelets by accident. I was working on software involved with financial time series (e.g., equity open and close price), so I suppose that it was an accident waiting to happen. I was reading the February 2001 issue of WIRED magazine when
I saw the graph included below. Every month WIRED runs various graphic visualizations of financial data and this was one of them.
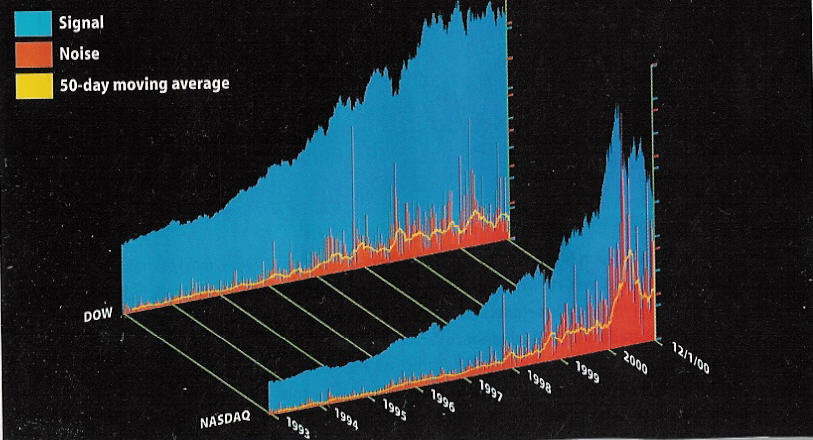
If stock prices do indeed factor in all knowable information, a composite price graph should proceed in an orderly fashon, as new information nudges perceived value against the pull of established tendencies. Wavelet analysis, widely used in communications
to separate signal (patterned motion) from noise (random activity), suggests otherwise.
This image shows the results of running a Haar transform - the fundamental wavelet formula -- on the daily close of the Dow and NASDQ since 1993. The blue mountains constitute signal. The embedded red spikes represent noise, of which the yellow line follows
a 50-day moving average.
Noise, which can be regarded as investor ignorance, has risen along with the value of both indices. But while noise in the Dow has grown 500 percent on average, NASDAQ noise has ballooned 3,000 percent, far outstripping NASDAQ's spectacular 500-percent growth
during the same period. Most of this increase has occurred since 1997, with an extraordinary surge since January 2000. Perhaps there was a Y2K glich after all -- one that derailed not operating systems and CPUs, but --> -- investor psychology. - Clem Chambers
(clemc@advfn.com).
Graph and quote from WIRED Magazine, February 2001, page 176
I am a Platonist. I believe that, in the abstract, there is truth, but that we can never actually reach it. We can only reach an approximation, or a shadow of truth. Modern science expresses this as Heisenberg uncertainty.
A Platonist view of a financial time series is that there is a "true" time series that is obscured to some extent by noise. For example, a close price or bid/ask time series for a stock moves on the basis of the supply and demand for shares. In the case of
a bid/ask time series, the supply/demand curve will be surrounded by the noise created by random order arrival. If, somehow, the noise could be filtered out, we would see the "true" supply/demand curve. Software which uses this information might be able to
do a better job because it would not be confused by false movements created by noise.
The WIRED graph above suggests that wavelet analysis can be used to filter a financial time series to remove the associated noise. Of course there is a vast area that is not addressed by the WIRED quote. What, for example, constitutes noise? What are wavelets
and Haar wavelets? Why are wavelets useful in analyzing financial time series? When I saw this graph I knew answers to none of these questions.
The analysis provided in the brief WIRED paragraph is shallow as well. Noise in the time series increases with trading volume. In order to claim that noise has increased, the noise should be normalized for trading volume.
What a long, strange trip its been
Reading is a dangerous thing. It can launch you off into strange directions. I moved from California to Santa Fe, New Mexico because I read a book.That one graph in WIRED magazine launched me down a path that I spent many months following. Like any adventure, I'm not sure if I would have embarked on this one if I had known how long and, at times, difficult, the journey would be.
Years ago, when it first came out, I bought a copy of the book The World According to Wavelets by Barbara Hubbard, on the basis of a review
I read in the magazine Science. The book sat on my shelf unread until I saw the WIRED graph.
Wavelets have been somewhat of a fad, a buzzword that people have thrown around. Barbara Hubbard started writing The World According to Wavelets when
the wavelet fad was starting to catch fire. She provides an interesting history of how wavelets developed in the mathematical and engineering worlds. She also makes a valiant attempt to provide an explanation of what the wavelet technique is. Ms. Hubbard is
a science writer, not a mathematician, but she mastered a fair amount of basic calculus and signal processing theory (which I admire her for). When she wrote The
World According to Wavelets there were few books on wavelets and no introductory material. Although I admire Barbara Hubbard's heroic effort, I had only a surface understanding of wavelets after reading The
World According to Wavelets.
There is a vast literature on wavelets and their applications. From the point of view of a software engineer (with only a year of college calculus), the problem with the wavelet literature is that it has largely been written by mathematicians, either for other
mathematicians or for students in mathematics. I'm not a member of either group, so perhaps my problem is that I don't have a fluent grasp of the language of mathematics. I certianly feel this when ever I read journal articles on wavelets. However, I have
tried to concentrate on books and articles that are explicitly introductory and tutorial. Even these have proven to be difficult.
The first chapter of the book Wavelets Made Easy by Yves Nievergelt starts out with an explaination of Haar wavelets (these are the wavelets
used to generate the graph published in WIRED). This chapter has numerous examples and I was able to understand and implement Haar wavelets from this material (links to my Java code for Haar wavelets can be found below). A later chapter discusses the Daubechies
wavelet transform. Unfortunately, this chapter of Wavelets Made Easy does not seem to be as good as the material on Haar wavelets. There
appear to be a number of errors in this chapter and implementing the algorithm described by Nievergelt does not result in a correct wavelet transform. Among other things, the wavelet coefficients for the Daubechies wavelets seem to be wrong. My web page on
the Daubechies wavelet transform can be found here.
The book Ripples in Mathematics (see the references at the end of the web page) is a better reference.
The wavelet technique for analyzing a signal or time series
There is a vast literature on wavelets. This includes thousands of journal articles and many books. The books on wavelets range from relatively introductory works like Nievergelt's WaveletsMade Easy (which is still not light reading) to books that are accessable only to graduate students in mathematics. There is also a great deal of wavelet material on the Web. This includes a number of tutorials (see Web
based reference, below).
Given the vast literature on wavelets, there is no need for yet another tutorial. But it might be worth while to summarize my view of wavelets as they are applied to 1-D signals or time series (an image is 2-D data). A time series is simply a sample of a signal
or a record of something, like temperature, water level or market data (like equity close price).
Wavelets allow a time series to be viewed in multiple resolutions. Each resolution reflects a different frequency. The wavelet technique takes averages and differences of a signal, breaking the signal down into spectrum. All the wavelet algorithms that I'm
familiar with work on time series a power of two values (e.g., 64, 128, 256...). Each step of the wavelet transform produces two sets of values: a set of averages and a set of differences (the differences are referred to as wavelet coefficients). Each step
produces a set of averages and coefficients that is half the size of the input data. For example, if the time series contains 256 elements, the first step will produce 128 averages and 128 coefficients. The averages then become the input for the next step
(e.g., 128 averages resulting in a new set of 64 averages and 64 coefficients). This continues until one average and one coefficient (e.g., 20)
is calculated.
The average and difference of the time series is made across a window of values. Most wavelet algorithms calculate each new average and difference by shifting this window over the input data. For example, if the input time series contains 256 values, the window
will be shifted by two elements, 128 times, in calculating the averages and differences. The next step of the calculation uses the previous set of averages, also shifting the window by two elements. This has the effect of averaging across a four element window.
Logically, the window increases by a factor of two each time.
In the wavelet literature this tree structured recursive algorithm is referred to as a pyramidal algorithm.
The power of two coefficient (difference) spectrum generated by a wavelet calculation reflect change in the time series at various resolutions. The first coefficient band generated reflects the highest frequency changes. Each later band reflects changes at
lower and lower frequencies.
There are an infinite number of wavelet basis functions. The more complex functions (like the Daubechies wavelets) produce overlapping averages and differences that provide a better average than the Haar wavelet at lower resolutions. However, these algorithms
are more complicated.
The Language of Wavelets
Every field of specialty develops its own sub-language. This is certainly true of wavelets. I've listed a few definitions here which, if I had understood their meaning would have helped me in my wanderings through the wavelet literature.Wavelet
A function that results in a set of high frequency differences, or wavelet coefficients. In lifting
scheme terms the wavelet calculates the difference between a prediction and an actual value.
If we have a data sample si, si+1,
si+2... the Haar wavelet equations is
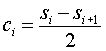
Where ci is
the wavelet coefficient.
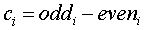
The wavelet Lifting Scheme uses
a slightly different expression for the Haar wavelet:
Scaling Function
The scaling function produces a smoother version of the data set, which is half the size of the input data set. Wavelet algorithms are recursive and the smoothed data becomes the input for the next step of the wavelet transform. The Haar wavelet scaling function
is
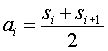
where ai is
a smoothed value.
The Haar transform preserves the average in the smoothed values. This is not true of all wavelet transforms.
High pass filter
In digital signal processing (DSP) terms, the wavelet function is a high pass filter. A high pass filter allows the high frequency components of a signal through while suppressing the low frequency components. For example, the differences that are captured
by the Haar wavelet function represent high frequency change between an odd and an even value.
Low pass filter
In digital signal processing (DSP) terms, the scaling function is a low pass filter. A low pass filter suppresses the high frequency components of a signal and allows the low frequency components through. The Haar scaling function calculates the average of
an even and an odd element, which results in a smoother, low pass signal.
Orthogonal (or Orthonormal) Transform
The definition of orthonormal (a.k.a. orthogonal) tranforms in Wavelet Methods for Time Series Analysis by Percival and Walden, Cambridge
University Press, 2000, Chaper 3, section 3.1, is one of the best I've seen. I've quoted this below:
Orthonormal transforms are of interst because they can be used to re-express a time series in such a way that we can easily reconstruct the series from its transform. In a loose sense, the "information" in the transform is thus equivalent to the "information"
is the original series; to put it another way, the series and its transform can be considered to be two representations of the same mathematical entity.
In terms of wavelet transforms this means that the original time series can be exactly reconstructed from the time series average and coefficients generated by an orthogonal (orthonormal) wavelet transform.
Signal estimation
This is also referred to as "de-noising". Signal estimation algorithms attempt to characterize portions of the time series and remove those that fall into a particular model of noise.
Applying Wavelets and Java Source Code
These Web pages publish some heavily documented Java source code for the Haar wavelet transform. Books like Wavelets Made Easy explain someof the mathematics behind the wavelet transform. I have found, however, that the implemation of this code can be at least as difficult as understanding the wavelet equations. For example, the in-place Haar wavelet transform produces wavelet coefficients in
a butterfly pattern in the original data array. The Java source published here includes code to reorder the butterfly into coefficient spectrums which are more useful when it comes to analyzing the data. Although this code is not large, it took me most of
a Saturday to implement the code to reorder the butterfly data pattern.
The wavelet Lifting Scheme, developed by Wim Sweldens and others provides a simpler way to look as many wavelet algorithms. I started to work on Lifting Scheme wavelet implementations after I had written this web page and developed the software. The Haar wavelet
code is much simpler when expressed in the lifting scheme. See my web page The
Wavelet Lifting Scheme.
The link to the Java source download Web page is below.
Financial Time Series
There are a variety of wavelet analysis algorithms. Different wavelet algorithms are appplied depending on the nature of the data analyzed. The Haar wavelet, which is used here is very fast and works well for the financial time series (e.g., the close pricefor a stock). Financial time series are non-stationary (to use a signal processing term). This means that even within a window, financial time series cannot be described well by a combination of sin and cos terms. Nor are financial time series cyclical in
a predictable fashion (unless you believe in Elliot waves).
Financial time series lend themselves to Haar wavelet analysis since graphs of financial time series tend to jagged, without a lot of smooth detail. For example, the graph below shows the daily close price for Applied Materials over a period of about two years.
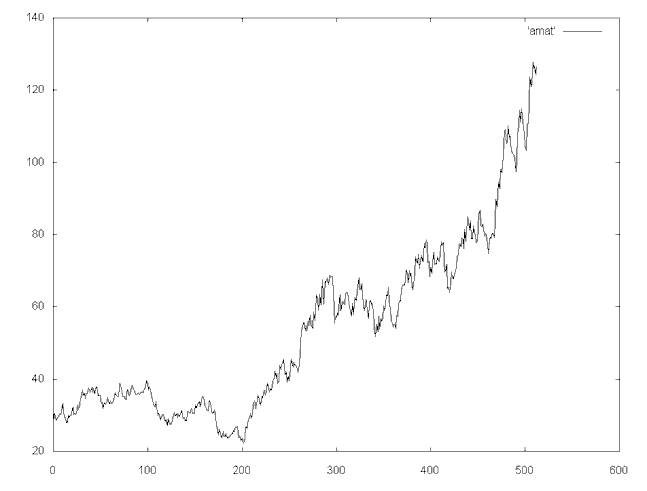
Daily close price for Applied Materials (symbol: AMAT), 12/18/97 to 12/30/99.
The Haar wavelet algorithms I have implemented work on data that consists of samples that are a power of two. In this case there are 512 samples.
Why Haar Wavelets?
There are a wide variety of popular wavelet algorithms, including Daubechies wavelets,Mexican Hat wavelets and Morlet wavelets. These wavelet algorithms have the advantage of better resolution for smoothly changing time series. But they have the disadvantage of being more expensive to calculate than the Haar wavelets. The higer resolution provided
by these wavlets is not worth the cost for financial time series, which are characterized by jagged transitions.
Haar Wavelets
The Haar wavelet algorithms published here are applied to time series where the number of samples is a power of two (e.g., 2, 4, 8, 16, 32, 64...) The Haar wavelet uses a rectangular window to sample the time series. The first pass over the time series usesa window width of two. The window width is doubled at each step until the window encompasses the entire time series.
Each pass over the time series generates a new time series and a set of coefficients. The new time series is the average of the previous time series over the sampling window. The coefficients represent the average change in the sample window. For example, if
we have a time series consisting of the values v0, v1,
... vn,
a new time series, with half as many points is calculated by averaging the points in the window. If it is the first pass over the time series, the window width will be two, so two points will be averaged:
for (i = 0; i < n; i = i + 2)
si = (vi + vi+1)/2;
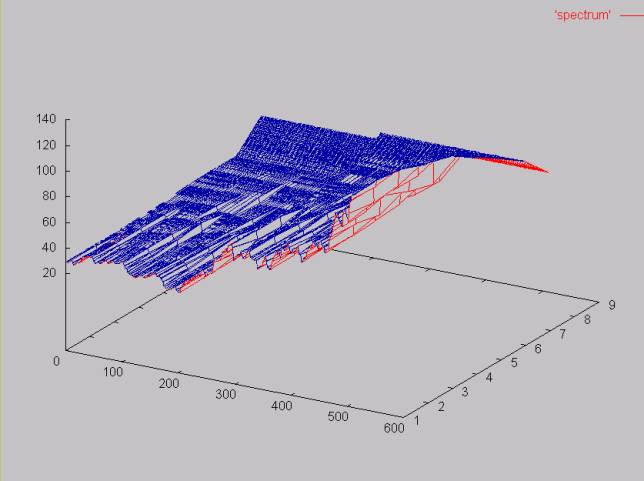
The 3-D surface below graphs nine wavelet spectrums generated from the 512 point AMAT close price time series. The x-axis shows the sample number, the y-axis shows the average value at that point and the z-axis shows log2 of
the window width.
The wavelet coefficients are calcalculated along with the new average time series values. The coefficients represent the average change over the window. If the windows width is two this would be:
for (i = 0; i < n; i = i + 2)
ci = (vi - vi+1)/2;
The graph below shows the coefficient spectrums. As before the z-axis represents the log2 of
the window width. The y-axis represents the time series change over the window width. Somewhat counter intutitively, the negative values mean that the time series is moving upward
vi is less than vi+1
so
vi - vi+1 will be less than zero
Positive values mean the the time series is going down, since vi is
greater than vi+1.
Note that the high frequency coefficient spectrum (log2(windowWidth)
= 1) reflects the noisiest part of the time series. Here the change between values fluctuates around zero.
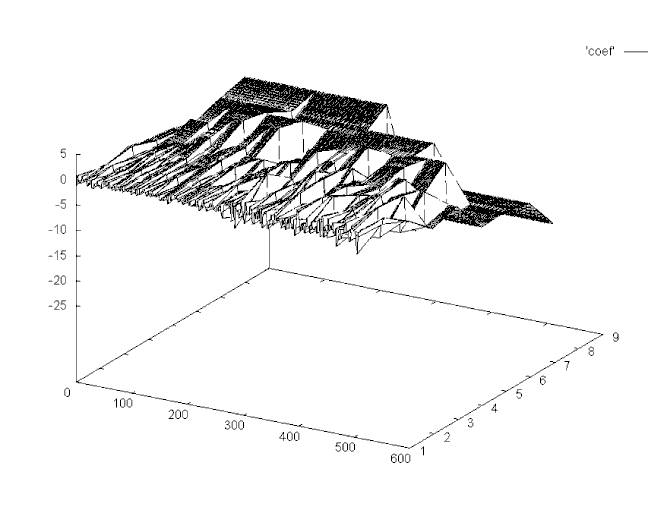
Plot of the Haar coefficient spectrum. The surface plots the highest frequency spectrum in the front and the lowest frequency spectrum in the back. Note that the highest frequency spectrum contains most of the noise.
Filtering Spectrum
The wavelet transform allows some or all of a given spectrum to be removed by setting the coefficients to zero. The signal can then be rebuilt using the inverse wavelet transform. Plots of the AMAT close price time series with various spectrum filtered outare shown here.
Noise Filters
Each spectrum that makes up a time series can be examined independently. A noise filter can be applied to each spectrum removing the coefficients that are classified as noise by setting the coefficients to zero.This web
page shows a histogram analysis of the three highest frequency spectrum of the AMAT close price. The result of a filter that removes the points that fall within a gaussian curve in each spectrum is also shown. The gaussian curve has a mean and standard
deviation of the coefficients in that spectrum.
Another way to remove noise is to use thresholding. My web page outlining one thresholding algorithm can be found here.
Wavelets vs. Simple Filters
How do Haar wavelet filters compare to simple filters, like windowed mean and median filters? A plot of the AMAT time series, filtered with a median filter (which in this case is virtually identical to a mean filter) is shown here here.These filters can be compared to the spectrum filters (where a given wavelet coefficient spectrum is filered out) here..
Whether a wavelet filter is better than a windowed mean filter depends on the application. The wavelet filter allows specific parts of the spectrum to be filtered. For example, the entire high frequency spectrum can be removed. Or selected parts of the spectrum
can be removed, as is done with the gaussian noise filter. The power of Haar wavelet filters is that they can be efficiently calculated and they provide a lot of flexibility. They can potentially leave more detail in the time series, compared to the mean or
median filter. To the extent that this detail is useful for an application, the wavelet filter is a better choice.
Limitations of the Haar Wavelet Transform
The Haar wavelet transform has a number of advantages:It is conceptually simple.
It is fast.
It is memory efficient, since it can be calculated in place without a temporary array.
It is exactly reversible without the edge effects that are a problem with other wavelet trasforms.
The Haar transform also has limitations, which can be a problem for some applications.
In generating each set of averages for the next level and each set of coefficients, the Haar transform performs an average and difference on a pair of values. Then the algorithm shifts over by two values and calculates another average and difference on the
next pair.
The high frequency coefficient spectrum should reflect all high frequency changes. The Haar window is only two elements wide. If a big change takes place from an even value to an odd value, the change will not be reflected in the high frequency coefficients.
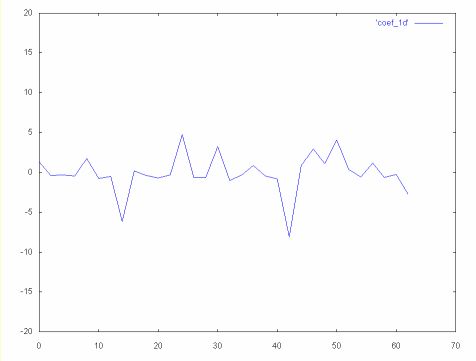
For example, in the 64 element time series graphed below, there is a large drop between elements 16 and 17, and elements 44 and 45.
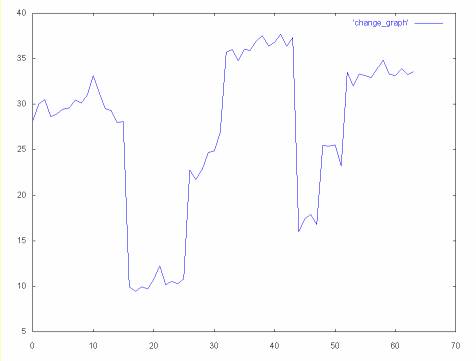
Since these are high frequency changes, we might expect to see them reflected in the high frequency coefficients. However, in the case of the Haar wavelet transform the high frequency coefficients miss these changes, since they are on even to odd elements.
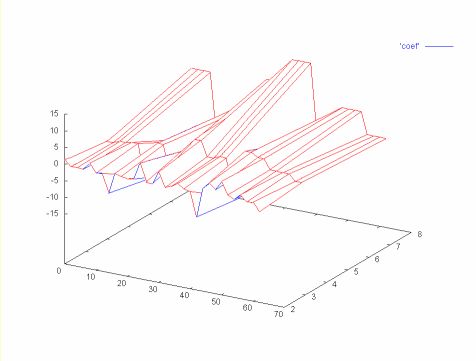
The surface below shows three coefficient spectrum: 32, 16 and 8 (where the 32 element coefficient spectrum is the highest frequency). The high frequency spectrum is plotted on the leading edge of the surface. the lowest frequency spectrum (8) is the far edge
of the surface.
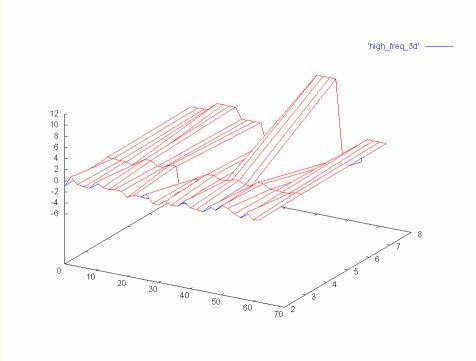
Note that both large magnitude changes are missing from the high frequency spectrum (32). The first change is picked up in the next spectrum (16) and the second change is picked up in the last spectrum in the graph (8).
Many other wavelet algorithms, like the Daubechies wavelet algorithm, use overlapping windows, so the high frequency spectrum reflects all changes in the time series. Like the Haar algorithm, Daubechies shifts by two elements at each step. However, the average
and difference are calculated over four elements, so there are no "holes".
The graph below shows the high frequency coefficient spectrum calculated from the same 64 element time series, but with the Daubechies D4 wavelet algorithm. Because of the overlapping averages and differences the change is reflected in this spectrum.
The 32, 16 and 8 coefficient spectrums, calculated with the Daubechies D4 wavelet algorithm, are shown below as a surface. Note that the change in the time series is reflected in all three coefficient spectrum.
Wavelets and Parallelism
Wavelet algorithms are naturally parallel. For example, if enough processing elements exist, the wavelet transform for a particular spectrum can be calculated in one step by assigning a processor for every two points. The parallelism in the wavelet algorithmmakes it attractive for hardware implementation.
Java Source Code Download
The Web page for downloading the Haar wavelet source code can be found here.This Java code is extensively documented and this web page includes a link to the Javadoc generated documentation.
A simpler version of the Haar wavelet algorithm can be found via my web page The
Wavelet Lifting Scheme.
Resources
GnuPlotThe plots above are generated with gnuplot for Windows NT. See my web page
of Gnuplot links here. I am only marginally statisified
with gnuplot. The software is easy to use and the Windows NT version comes with a nice GUI and a nice help system. However, when it comes to 3-D plots, the software leaves some things to be desired. The hidden line removal consumes vast amounts of virtual
memory. When I tried to plot one of the coefficients surfaces with the x and z axes switched, it ran out of memory on a Windows NT system with 256K of virtual memory. Also, the surface would be much easier to understand if it could be colored with a spectrum.
If you know of a better 3D plotting package that runs on Windows NT, please drop me a note.
I have also had a hard time getting gnuplot to generate 2-D plots with multiple lines that have different colors. I have succeeded in doing this only when the data for each line was in a separate file, which can be awkward.
ROOT: An Object Oriented Data Analysis Framework
I was sent the reference to Root by a physicist, Costas A. Root is a data analysis framework that is targeted at the massive amounts of data generated by high energy physics experiments at CERN and elsewhere.
Although Root leans heavily toward physics, it looks to me like Root would be useful in other areas. Some of the statistical techniques that are used to analyze results in experimental physics is also used in quantitive finance, for example.
Root has different goals than gnuPlot. It is targeted at a much more challenging data analysis enviroment (terabytes of data). But it has a large learning curve and I'm skeptical if it can be easily used by those who do not have a sophisticated command of C++.
In contrast gnuPlot is a simple plotting environment. So my search for a better plotting environment continues. I know that such environments are supported by Matlab and Mathematics, but these packages are too expensive for my limited software budget.
References
Books
Ripples in Mathematics: the Discrete Wavelet Transform by Jensen and la Cour-Harbo, 2001So far this is the best book I've found on wavelets. I read this book after I had spent months reading many of the references that follow, so I'm not sure how easy this book would be for someone with no previous exposure to wavelets. But I have yet to find
any "easy" reference. Ripples in Mathematics covers Lifting Scheme wavelets which are easier to implement and understand. The book is written
at a relatively introductory level and is aimed at engineers. The authors provide implementations for a number of wavelet algorithms. Ripples also
covers the problem of applying wavelet algorithms like Daubechies D4 to finite data sets (e.g., they cover some solutions for the edge problems encountered for Daubechies wavelets).
Wavelets and Filter Banks by Gilbert Strang and Truong Nguyen, Wellesley Cambridge Pr, 1996
A colleague recommend this book, although he could not load it to me since it is packed away in a box. Sadly this book is hard to find. I bought my copy via abebooks.com, used, from a book dealer in Australia. While I was waiting for the book I read a few of
Gilbert Strang's journal articles. Gilbert Strang is one of the best writers I've encountered in mathematics. I have only just started working through this book, but it looks like an excellent, although mathematical, book on wavelets.
Wavelets Made Easy by Yves Nievergelt, Birkhauser, 1999
This books has two excellent chapters on Haar wavelets (Chapter 1 covers 1-D Haar wavelets and Chapter 2 covers 2-D wavelets). At least in his coverage of Haar wavelts, Prof. Nievergelt writes clearly and includes plenty of examples. The coverage of Haar wavelets
uses only basic mathematics (e.g., algebra).
Following the chapter on Haar wavelets there is a chapter on Daubechies wavelets. Daubechies wavelets are derived from a general class of wavelet transforms, which includes Haar wavelets. Daubechies wavelets are better for smoothly changing time series, but
are probably overkill for financial time series. As Wavelets Made Easy progresses, it gets less easy. Following the chapter on Daubechies
wavelets is a discussion of Fourier transforms. The later chapters delve into the mathematics behind wavelets. Prof. Nievergelt pretty much left me behind at the chapter on Fourier transforms. For an approachable discussion of Fourier transforms, see Understanding
Digital Signal Processing by Richard G. Lyons (below).
As Wavelets Made Easy progresses, it becomes less and less useful for wavelet algorithm implementation. In fact, while the mathematics Nievergelt
uses to describe Daubechies wavelets is correct, the algorithm he describes to implement the Daubechies transform and inverse transform seems to be wrong.
Wavelets Made Easy does not live up to the "easy" part of its title. Given this and the apparent errors in the Daubechies coverage, I am sorry
to say that I can't recommend this book. Save your money and buy a copy of Ripples in Mathematics.
Discovering Wavelets by Edward Aboufadel and Steven Schlicker
At 125 pages, this is one of the most expensive wavelet books I've purchased, on a per page basis. It sells on Amazon for
$64.95 US. I bought it used for $42.50.
If Discovering Wavelets provided a short, clear description of wavelets, the length would be a virtue, not a fault. Sadly this is not the
case. Discovering Waveletsseems to be a book written for college students who have completed calculus and linear algebra. The book is heavy
on theorms (which are incompletely explained) and very sort on useful explaination. I found the description of wavelets unnecessarily obscure. For example, Haar wavelets are described in terms of linear algebra. They can be much more simply described in terms
of sums, differences and the so called pyramidal algorithm.
While Discovering Wavelets covers some important material, its coverage is so obscure and cursory that I found the book useless. The book
resembles a set of lecture notes and is of little use without the lecture (for their student's sake I hope that Aboufadel and Schlicker are better teachers than writers). This is a book that I wish I had not purchased.
Wavelet Methods for Time Series Analysis by Donald B. Percival and Andrew T. Walden, Cambridge University Press, 2000
I'm not a mathematician and I don't play one on television. So this book is heavy going for me. Never the less, this is a good book. For someone with a better mathematical background this might be an excellent book. The authors provide a clear discussion of
wavelets and a variety of time series analsysis techniques. Unlike some mathematicians, Percival and Walden actually coded up the wavelet algorithms and understand the difficulties of implementation. They compare various wavelet families for various applications
and chose the simplest one (Haar) in some cases.
One of the great benifits of Wavelet Methods for Time Series Analysis is that it provides a clear summary of a great deal of the recent research.
But Percival and Walden put the research in an applied context. For example Donoho and Johnstone published an equation for wavelet noise reduction. I have been unable to find all of their papers on the Web and I have never understood how to calculate some
of the terms in the equation in practice. I found this definition in Wavelet Methods.
The World According to Wavelets: The Story of a Mathematical Technique in the Making by Barbara Burke Hubbard, A.K. Peters, 1996
This book provides an interesting history of the development of wavelets. This includes sketches of many of the people involved in pioneering the application and mathematical theory behind wavelets. Although Ms. Hubbard makes a heroic effort, I found the explaination
of wavelets difficult to follow.
The Cartoon Guide To Statistics by Larry Gonic and Woollcott Smith, Harper Collins
I work with a number of mathematicians, so it's a bit embarrassing to have this book on my disk. I never took statistics. In college everyone I knew who took statistics didn't like it. Since it was not required for my major (as calculus was), I did not take
statistics. I've come to understand how useful statistics is. I wanted to filter out Gaussian noise, so I needed to understand normal curves. Although the title is a bit embarrassing, The
Cartoon Guide to Statistics provided a very rapid and readable introduction to statistics.
Understanding Digital Signal Processing by Richard G. Lyons.
This book is fantastic. Perhaps the best introductory book ever written on digital signal processing. It is the book on signal processing
for software engineers like myself with tepid mathematical backgrounds. It provides the best coverage I've ever seen on DFTs and FFTs. In fact, this book has inspired me to try FFTs
on financial time series (an interesting experiment, but wavelets produce better results and Fourier transforms on non-stationary time series).
See my web page A Notebook Compiled While Reading Understanding
Digital Signal Processing by Lyons
Web based references
My web page on the wavelet LiftingScheme. The Haar wavelet algorithm expressed using the wavelet Lifting Scheme is considerably simpler than the algorithm referenced above. The Lifting Scheme also allows Haar wavelet to be extended into a wavelet algorithms that have perfect reconstruction
and have better multiscale resolution than Haar wavelets.
Haar Wavelet Transform by Emil Mikulic
Emil Mikulic has published a simple explaination of the Haar transform, for both 1-D and 2-D data. For those who find my explaination obscure, this might be a good resource.
The
Wavelet Tutorial: The Engineer's Ultimate Guide to Wavelet Analysis, by Robi Polikar.
The "ultimate guide" to wavelet analysis has yet to be written, at least for my purposes. But Prof. Polikar's Wavelet Tutorial is excellent.
When it comes to explaining Wavelets and Fourier transforms, this is one of the best overviews I've seen. Prof. Polikar put a great deal of work into this tutorial and I am greateful for his effort. However, there was not sufficient detail in this tutorial
to allow me to create my own wavelet and inverse wavelet tranform software.
A Really Friendly Guide to Wavelets
This Web page (which is also available in PDF) provides a nice overview of the theory behind wavelets. But as with Robi Polikar's web page, its a big step from this material to a software implementation. Whether this Web page is "really friendly" depends on
who your friends are. If you friends are calculus and taylor series, then this paper is for you. After working my way through a good part of Wavelets
Made Easy this paper filled in some hole for me. But I would not have understood it if I had read it before Wavelets Made Easy.
Bell Labs Wavelets Group Home Page
Wim Sweldens, who has published a lot of material on the Web (he is the editor of Wavelet
Digest) and elsewhere on Wavelets is a member of this group. An interesting site with lots of great links to other web resources.
See also Wim Swelden's Wavelet Cascade Java
Applet
Lifting Scheme Wavelets
Win Sweldens and Ingrid Daubechies invented a new wavelet technique known as the lifting scheme. Gabriel Fernandez has published an excellent
bibliography on the lifting scheme wavelets which can be found here.
This bibliography has a pointer to Wim Sweldens' and Peter Schroder's lifting scheme tutorial Building Your Own Wavelets at Home.
Clemens Valens has written a tutorial on
the fast lifting wavelet transform. This is a rather mathematically oriented tutorial. For many, Wim Sweldens' paper Building Your Ownh Wavlets
at Home may be easier to under stand (although I still found this paper heavy going).
Gabriel Fernandez has developed LiftPack. The LiftPack
Home Page publishes the LiftPack software. The bibliography is a sub-page of the LiftPack Home page.
See also my web page on The Wavelet
Lifting Scheme.
Wavelets in Computer Graphis
One of the papers referenced in Gabriel Fernandez's lifting scheme bibliography is Wim Sweldens and Peter Schroder's paper Building
Your Own Wavelets at Home. This is part of a course on Wavelets
in Computer Graphics given at SigGraph 1994, 1995 and 1996. The sigGraph course coverd an amazing amount of material.Building Your Own Wavelets
at Home was apparently covered in a morning. There are a lot of mathematically gifted people in computer graphics. But even for these people, this looks like tough going for a morning. I've spent hours reading and rereading this tutorial before I understood
it enough to implement the polynomial interpolation wavelets that it discusses.
Wavelet Shrinkage (denoising)
D. Donoho Wavelet
Shrinkage and W.V.D. -- A Ten-Minute Tour, (figures),
1993.
D. Donoho De-Noising
By Soft-Thresholding, IEEE Trans. on Information Theory, Vol 41, No. 3, pp. 613-627, 1995.
D. Donoho Adapting
to Unknown Smoothness via Wavelet Shrinkage, JASA , 1995.
CalTech Multi-Resolution Modeling Group Publications
The Wavelets in Computer Graphics page, referenced above, is one of the links from the CalTech Multi-resolution
Modeling Group Publications web page. The wavelet publications referenced on this page concentrate on wavelet applications for computer graphics.
Tutorial on Continuous Wavelet Analysis of Experiemental
Data by Jacques Lewalle, Syracuse University.
This is yet another "introductory" tutorial by a mathematician. It gives a feeling for what you can do with wavelets, but there is not enough detail to understand the details of implementing wavelet code.
Amara's Wavelet Page
Amara Graps' web page provides some good basic introductory material on wavelets and some excellent links to other Web resources. There is also a link to the author's (Amara) IEEE
Computational Sciences and Engineering article on wavelets.
Wave++ from Ryerson Polytechnic University Computational Signals Analysis Group
Wave++ is a C++ class library for wavelet and signal
analysis. This library is provided in source form. I have not examined it in detail yet.
Wavelet and signal processing algorithms are usually fairly simple (they consist of a relatively small amount of code). My experience has been that the implementation of the algorithms is not as time consuming as understanding the algorithms and how they can
be applied. Since one of the best ways to understand the algorithms is to implement and apply them, I'm not sure how much leverage Wave++ provides unless you already understand wavelet algorithms.
Wavelet Compression Arrives by Peter Dyson, Seybold Reports,
April 1998.
This is an increasingly dated discussion on wavelet compression products, especially for images. The description of the compression products strengths and weaknesses is good, but the description of wavelets is poor.
Web page of Zbigniew R. Struzik
Prof. Zbigniew R. Struzik of Centrum voor Wiskunde en Informatica in the Netherlands has done some very interesting work with wavelets in a variety of areas, including data mining in finance. This web page has a link to Prof. Struzik's publications (at the
bottom of the Web page). Prof. Struzik's work also shows some interesting connections between fractals and wavelets.
Disclaimer
This web page was written on nights and weekends, using my computer resources. This Web page does not necessarily reflect the views of my employer (at the time this web page was written). Nothing published here should be interpreted as a reflection on any techniquesused by my employer (at that time).
Ian Kaplan, July 2001
Revised: February 2004

Applying the Haar Wavelet Transform to Time Series Information
| Contents |
|---|
| Introduction |
| What a long, strange trips its been |
| The wavelet technique for analyzing a signal or time series |
| The Language of Wavelets |
| Applying Wavelets and Java Source Code |
| Financial Time Series |
| Why Haar Wavelets? |
| Haar Wavelets |
| Filtering Spectrum |
| Noise Filters |
| Wavelets vs. Simple Filters |
| Limitations of the Haar Wavelet Transform |
| Wavelets and Parallelism |
| Java Source Code Download |
| Resources |
| References, Books |
| References, Web published |
| Links to sub-pages |
|---|
| Daubechies Wavelets |
| Filtering Using Haar Wavelets |
| The Haar Wavelet Transform and Noise Filters |
| Wavelet Noise Thresholding |
| Wavelets vs. Simple Filters |
| Wavelets in Java (includes histogramming and simple statistical algorithms) |
Introduction
This was the first web page I wrote on Wavelets. From this seed grew other web pages which discuss a variety of wavelet related topics. For a "table of contents" seeWaveletsand Signal Processing. This web page applies the wavelet transform to a time series composed of stock market close prices. Later web pages expand on this work in a variety of areas (e.g., compression, spectral analysis and forecasting).
When I started out I thought that I would implement the Haar wavelet and that some of my colleagues might find it useful. I did not expect signal processing to be such an interesting topic. Nor did I understand who many different areas of computer science,
mathematics, and quantitative finance would be touched by wavelets. I kept finding that "one thing lead to another", making it difficult to find a logical stopping place. This wandering path of discovery on my part also accounts for the somewhat organic growth
of these web pages. I have tried to tame this growth and organize it, but I fear that it still reflects the fact that I did not know where I was going when I started.
The Java code published along with this web page reflect the first work I did on wavelets. More sophisticated, lifting scheme based, algorithms, implemented in Java can be found on other web pages. The wavelet lifting scheme code, published on other web pages,
is simpler and easier to understand. The wavelet lifting scheme also provides an elegant and powerful framework for implementing a range of wavelet algorithms.
In implementing wavelet packet algorithms, I switched from Java to C++. The wavelet packet algorithm I used is simpler and more elegant using C++'s operator overloading features. C++ also supports generic data structures (templates), which allowed me to implement
a generic class hierarchy for wavelets. This code includes several different wavelet algoriths, including Haar, linear interpolation and Daubechies D4.
Like the wavelet algorithms, the financial modeling done here represents very early work. When I started working on these web pages I had no experience with modeling financial time series. The work described on this web page lead to more intensive experiments
with wavelet filters in financial models, which I continue to work on. On this web page I use stock market close prices. In financial modeling one usually uses returns, since what you are trying to predict is future return.
I became interested in wavelets by accident. I was working on software involved with financial time series (e.g., equity open and close price), so I suppose that it was an accident waiting to happen. I was reading the February 2001 issue of WIRED magazine when
I saw the graph included below. Every month WIRED runs various graphic visualizations of financial data and this was one of them.
If stock prices do indeed factor in all knowable information, a composite price graph should proceed in an orderly fashon, as new information nudges perceived value against the pull of established tendencies. Wavelet analysis, widely used in communications
to separate signal (patterned motion) from noise (random activity), suggests otherwise.
This image shows the results of running a Haar transform - the fundamental wavelet formula -- on the daily close of the Dow and NASDQ since 1993. The blue mountains constitute signal. The embedded red spikes represent noise, of which the yellow line follows
a 50-day moving average.
Noise, which can be regarded as investor ignorance, has risen along with the value of both indices. But while noise in the Dow has grown 500 percent on average, NASDAQ noise has ballooned 3,000 percent, far outstripping NASDAQ's spectacular 500-percent growth
during the same period. Most of this increase has occurred since 1997, with an extraordinary surge since January 2000. Perhaps there was a Y2K glich after all -- one that derailed not operating systems and CPUs, but --> -- investor psychology. - Clem Chambers
(clemc@advfn.com).
Graph and quote from WIRED Magazine, February 2001, page 176
I am a Platonist. I believe that, in the abstract, there is truth, but that we can never actually reach it. We can only reach an approximation, or a shadow of truth. Modern science expresses this as Heisenberg uncertainty.
A Platonist view of a financial time series is that there is a "true" time series that is obscured to some extent by noise. For example, a close price or bid/ask time series for a stock moves on the basis of the supply and demand for shares. In the case of
a bid/ask time series, the supply/demand curve will be surrounded by the noise created by random order arrival. If, somehow, the noise could be filtered out, we would see the "true" supply/demand curve. Software which uses this information might be able to
do a better job because it would not be confused by false movements created by noise.
The WIRED graph above suggests that wavelet analysis can be used to filter a financial time series to remove the associated noise. Of course there is a vast area that is not addressed by the WIRED quote. What, for example, constitutes noise? What are wavelets
and Haar wavelets? Why are wavelets useful in analyzing financial time series? When I saw this graph I knew answers to none of these questions.
The analysis provided in the brief WIRED paragraph is shallow as well. Noise in the time series increases with trading volume. In order to claim that noise has increased, the noise should be normalized for trading volume.
What a long, strange trip its been
Reading is a dangerous thing. It can launch you off into strange directions. I moved from California to Santa Fe, New Mexico because I read a book.That one graph in WIRED magazine launched me down a path that I spent many months following. Like any adventure, I'm not sure if I would have embarked on this one if I had known how long and, at times, difficult, the journey would be.
Years ago, when it first came out, I bought a copy of the book The World According to Wavelets by Barbara Hubbard, on the basis of a review I
read in the magazine Science. The book sat on my shelf unread until I saw the WIRED graph.
Wavelets have been somewhat of a fad, a buzzword that people have thrown around. Barbara Hubbard started writing The World According to Wavelets when
the wavelet fad was starting to catch fire. She provides an interesting history of how wavelets developed in the mathematical and engineering worlds. She also makes a valiant attempt to provide an explanation of what the wavelet technique is. Ms. Hubbard is
a science writer, not a mathematician, but she mastered a fair amount of basic calculus and signal processing theory (which I admire her for). When she wrote The
World According to Wavelets there were few books on wavelets and no introductory material. Although I admire Barbara Hubbard's heroic effort, I had only a surface understanding of wavelets after reading The
World According to Wavelets.
There is a vast literature on wavelets and their applications. From the point of view of a software engineer (with only a year of college calculus), the problem with the wavelet literature is that it has largely been written by mathematicians, either for other
mathematicians or for students in mathematics. I'm not a member of either group, so perhaps my problem is that I don't have a fluent grasp of the language of mathematics. I certianly feel this when ever I read journal articles on wavelets. However, I have
tried to concentrate on books and articles that are explicitly introductory and tutorial. Even these have proven to be difficult.
The first chapter of the book Wavelets Made Easy by Yves Nievergelt starts out with an explaination of Haar wavelets (these are the wavelets used
to generate the graph published in WIRED). This chapter has numerous examples and I was able to understand and implement Haar wavelets from this material (links to my Java code for Haar wavelets can be found below). A later chapter discusses the Daubechies
wavelet transform. Unfortunately, this chapter of Wavelets Made Easy does not seem to be as good as the material on Haar wavelets. There appear
to be a number of errors in this chapter and implementing the algorithm described by Nievergelt does not result in a correct wavelet transform. Among other things, the wavelet coefficients for the Daubechies wavelets seem to be wrong. My web page on the Daubechies
wavelet transform can be found here.
The book Ripples in Mathematics (see the references at the end of the web page) is a better reference.
The wavelet technique for analyzing a signal or time series
There is a vast literature on wavelets. This includes thousands of journal articles and many books. The books on wavelets range from relatively introductory works like Nievergelt's WaveletsMade Easy (which is still not light reading) to books that are accessable only to graduate students in mathematics. There is also a great deal of wavelet material on the Web. This includes a number of tutorials (see Web
based reference, below).
Given the vast literature on wavelets, there is no need for yet another tutorial. But it might be worth while to summarize my view of wavelets as they are applied to 1-D signals or time series (an image is 2-D data). A time series is simply a sample of a signal
or a record of something, like temperature, water level or market data (like equity close price).
Wavelets allow a time series to be viewed in multiple resolutions. Each resolution reflects a different frequency. The wavelet technique takes averages and differences of a signal, breaking the signal down into spectrum. All the wavelet algorithms that I'm
familiar with work on time series a power of two values (e.g., 64, 128, 256...). Each step of the wavelet transform produces two sets of values: a set of averages and a set of differences (the differences are referred to as wavelet coefficients). Each step
produces a set of averages and coefficients that is half the size of the input data. For example, if the time series contains 256 elements, the first step will produce 128 averages and 128 coefficients. The averages then become the input for the next step
(e.g., 128 averages resulting in a new set of 64 averages and 64 coefficients). This continues until one average and one coefficient (e.g., 20)
is calculated.
The average and difference of the time series is made across a window of values. Most wavelet algorithms calculate each new average and difference by shifting this window over the input data. For example, if the input time series contains 256 values, the window
will be shifted by two elements, 128 times, in calculating the averages and differences. The next step of the calculation uses the previous set of averages, also shifting the window by two elements. This has the effect of averaging across a four element window.
Logically, the window increases by a factor of two each time.
In the wavelet literature this tree structured recursive algorithm is referred to as a pyramidal algorithm.
The power of two coefficient (difference) spectrum generated by a wavelet calculation reflect change in the time series at various resolutions. The first coefficient band generated reflects the highest frequency changes. Each later band reflects changes at
lower and lower frequencies.
There are an infinite number of wavelet basis functions. The more complex functions (like the Daubechies wavelets) produce overlapping averages and differences that provide a better average than the Haar wavelet at lower resolutions. However, these algorithms
are more complicated.
The Language of Wavelets
Every field of specialty develops its own sub-language. This is certainly true of wavelets. I've listed a few definitions here which, if I had understood their meaning would have helped me in my wanderings through the wavelet literature.Wavelet
A function that results in a set of high frequency differences, or wavelet coefficients. In lifting
scheme terms the wavelet calculates the difference between a prediction and an actual value.
If we have a data sample si, si+1,
si+2... the Haar wavelet equations is
Where ci is
the wavelet coefficient.
The wavelet Lifting Scheme uses
a slightly different expression for the Haar wavelet:
Scaling Function
The scaling function produces a smoother version of the data set, which is half the size of the input data set. Wavelet algorithms are recursive and the smoothed data becomes the input for the next step of the wavelet transform. The Haar wavelet scaling function
is
where ai is
a smoothed value.
The Haar transform preserves the average in the smoothed values. This is not true of all wavelet transforms.
High pass filter
In digital signal processing (DSP) terms, the wavelet function is a high pass filter. A high pass filter allows the high frequency components of a signal through while suppressing the low frequency components. For example, the differences that are captured
by the Haar wavelet function represent high frequency change between an odd and an even value.
Low pass filter
In digital signal processing (DSP) terms, the scaling function is a low pass filter. A low pass filter suppresses the high frequency components of a signal and allows the low frequency components through. The Haar scaling function calculates the average of
an even and an odd element, which results in a smoother, low pass signal.
Orthogonal (or Orthonormal) Transform
The definition of orthonormal (a.k.a. orthogonal) tranforms in Wavelet Methods for Time Series Analysis by Percival and Walden, Cambridge University
Press, 2000, Chaper 3, section 3.1, is one of the best I've seen. I've quoted this below:
Orthonormal transforms are of interst because they can be used to re-express a time series in such a way that we can easily reconstruct the series from its transform. In a loose sense, the "information" in the transform is thus equivalent to the "information"
is the original series; to put it another way, the series and its transform can be considered to be two representations of the same mathematical entity.
In terms of wavelet transforms this means that the original time series can be exactly reconstructed from the time series average and coefficients generated by an orthogonal (orthonormal) wavelet transform.
Signal estimation
This is also referred to as "de-noising". Signal estimation algorithms attempt to characterize portions of the time series and remove those that fall into a particular model of noise.
Applying Wavelets and Java Source Code
These Web pages publish some heavily documented Java source code for the Haar wavelet transform. Books like Wavelets Made Easy explain some ofthe mathematics behind the wavelet transform. I have found, however, that the implemation of this code can be at least as difficult as understanding the wavelet equations. For example, the in-place Haar wavelet transform produces wavelet coefficients in a
butterfly pattern in the original data array. The Java source published here includes code to reorder the butterfly into coefficient spectrums which are more useful when it comes to analyzing the data. Although this code is not large, it took me most of a
Saturday to implement the code to reorder the butterfly data pattern.
The wavelet Lifting Scheme, developed by Wim Sweldens and others provides a simpler way to look as many wavelet algorithms. I started to work on Lifting Scheme wavelet implementations after I had written this web page and developed the software. The Haar wavelet
code is much simpler when expressed in the lifting scheme. See my web page The
Wavelet Lifting Scheme.
The link to the Java source download Web page is below.
Financial Time Series
There are a variety of wavelet analysis algorithms. Different wavelet algorithms are appplied depending on the nature of the data analyzed. The Haar wavelet, which is used here is very fast and works well for the financial time series (e.g., the close pricefor a stock). Financial time series are non-stationary (to use a signal processing term). This means that even within a window, financial time series cannot be described well by a combination of sin and cos terms. Nor are financial time series cyclical in
a predictable fashion (unless you believe in Elliot waves).
Financial time series lend themselves to Haar wavelet analysis since graphs of financial time series tend to jagged, without a lot of smooth detail. For example, the graph below shows the daily close price for Applied Materials over a period of about two years.
Daily close price for Applied Materials (symbol: AMAT), 12/18/97 to 12/30/99.
The Haar wavelet algorithms I have implemented work on data that consists of samples that are a power of two. In this case there are 512 samples.
Why Haar Wavelets?
There are a wide variety of popular wavelet algorithms, including Daubechies wavelets,Mexican Hat wavelets and Morlet wavelets. These wavelet algorithms have the advantage of better resolution for smoothly changing time series. But they have the disadvantage of being more expensive to calculate than the Haar wavelets. The higer resolution provided
by these wavlets is not worth the cost for financial time series, which are characterized by jagged transitions.
Haar Wavelets
The Haar wavelet algorithms published here are applied to time series where the number of samples is a power of two (e.g., 2, 4, 8, 16, 32, 64...) The Haar wavelet uses a rectangular window to sample the time series. The first pass over the time series usesa window width of two. The window width is doubled at each step until the window encompasses the entire time series.
Each pass over the time series generates a new time series and a set of coefficients. The new time series is the average of the previous time series over the sampling window. The coefficients represent the average change in the sample window. For example, if
we have a time series consisting of the values v0, v1,
... vn,
a new time series, with half as many points is calculated by averaging the points in the window. If it is the first pass over the time series, the window width will be two, so two points will be averaged:
for (i = 0; i < n; i = i + 2)
si = (vi + vi+1)/2;
The 3-D surface below graphs nine wavelet spectrums generated from the 512 point AMAT close price time series. The x-axis shows the sample number, the y-axis shows the average value at that point and the z-axis shows log2 of
the window width.
The wavelet coefficients are calcalculated along with the new average time series values. The coefficients represent the average change over the window. If the windows width is two this would be:
for (i = 0; i < n; i = i + 2)
ci = (vi - vi+1)/2;
The graph below shows the coefficient spectrums. As before the z-axis represents the log2 of
the window width. The y-axis represents the time series change over the window width. Somewhat counter intutitively, the negative values mean that the time series is moving upward
vi is less than vi+1
so
vi - vi+1 will be less than zero
Positive values mean the the time series is going down, since vi is
greater than vi+1.
Note that the high frequency coefficient spectrum (log2(windowWidth)
= 1) reflects the noisiest part of the time series. Here the change between values fluctuates around zero.
Plot of the Haar coefficient spectrum. The surface plots the highest frequency spectrum in the front and the lowest frequency spectrum in the back. Note that the highest frequency spectrum contains most of the noise.
Filtering Spectrum
The wavelet transform allows some or all of a given spectrum to be removed by setting the coefficients to zero. The signal can then be rebuilt using the inverse wavelet transform. Plots of the AMAT close price time series with various spectrum filtered outare shown here.
Noise Filters
Each spectrum that makes up a time series can be examined independently. A noise filter can be applied to each spectrum removing the coefficients that are classified as noise by setting the coefficients to zero.This web
page shows a histogram analysis of the three highest frequency spectrum of the AMAT close price. The result of a filter that removes the points that fall within a gaussian curve in each spectrum is also shown. The gaussian curve has a mean and standard
deviation of the coefficients in that spectrum.
Another way to remove noise is to use thresholding. My web page outlining one thresholding algorithm can be found here.
Wavelets vs. Simple Filters
How do Haar wavelet filters compare to simple filters, like windowed mean and median filters? A plot of the AMAT time series, filtered with a median filter (which in this case is virtually identical to a mean filter) is shown here here.These filters can be compared to the spectrum filters (where a given wavelet coefficient spectrum is filered out) here..
Whether a wavelet filter is better than a windowed mean filter depends on the application. The wavelet filter allows specific parts of the spectrum to be filtered. For example, the entire high frequency spectrum can be removed. Or selected parts of the spectrum
can be removed, as is done with the gaussian noise filter. The power of Haar wavelet filters is that they can be efficiently calculated and they provide a lot of flexibility. They can potentially leave more detail in the time series, compared to the mean or
median filter. To the extent that this detail is useful for an application, the wavelet filter is a better choice.
Limitations of the Haar Wavelet Transform
The Haar wavelet transform has a number of advantages:It is conceptually simple.
It is fast.
It is memory efficient, since it can be calculated in place without a temporary array.
It is exactly reversible without the edge effects that are a problem with other wavelet trasforms.
The Haar transform also has limitations, which can be a problem for some applications.
In generating each set of averages for the next level and each set of coefficients, the Haar transform performs an average and difference on a pair of values. Then the algorithm shifts over by two values and calculates another average and difference on the
next pair.
The high frequency coefficient spectrum should reflect all high frequency changes. The Haar window is only two elements wide. If a big change takes place from an even value to an odd value, the change will not be reflected in the high frequency coefficients.
For example, in the 64 element time series graphed below, there is a large drop between elements 16 and 17, and elements 44 and 45.
Since these are high frequency changes, we might expect to see them reflected in the high frequency coefficients. However, in the case of the Haar wavelet transform the high frequency coefficients miss these changes, since they are on even to odd elements.
The surface below shows three coefficient spectrum: 32, 16 and 8 (where the 32 element coefficient spectrum is the highest frequency). The high frequency spectrum is plotted on the leading edge of the surface. the lowest frequency spectrum (8) is the far edge
of the surface.
Note that both large magnitude changes are missing from the high frequency spectrum (32). The first change is picked up in the next spectrum (16) and the second change is picked up in the last spectrum in the graph (8).
Many other wavelet algorithms, like the Daubechies wavelet algorithm, use overlapping windows, so the high frequency spectrum reflects all changes in the time series. Like the Haar algorithm, Daubechies shifts by two elements at each step. However, the average
and difference are calculated over four elements, so there are no "holes".
The graph below shows the high frequency coefficient spectrum calculated from the same 64 element time series, but with the Daubechies D4 wavelet algorithm. Because of the overlapping averages and differences the change is reflected in this spectrum.
The 32, 16 and 8 coefficient spectrums, calculated with the Daubechies D4 wavelet algorithm, are shown below as a surface. Note that the change in the time series is reflected in all three coefficient spectrum.
Wavelets and Parallelism
Wavelet algorithms are naturally parallel. For example, if enough processing elements exist, the wavelet transform for a particular spectrum can be calculated in one step by assigning a processor for every two points. The parallelism in the wavelet algorithmmakes it attractive for hardware implementation.
Java Source Code Download
The Web page for downloading the Haar wavelet source code can be found here.This Java code is extensively documented and this web page includes a link to the Javadoc generated documentation.
A simpler version of the Haar wavelet algorithm can be found via my web page The
Wavelet Lifting Scheme.
Resources
GnuPlotThe plots above are generated with gnuplot for Windows NT. See my web page
of Gnuplot links here. I am only marginally statisified
with gnuplot. The software is easy to use and the Windows NT version comes with a nice GUI and a nice help system. However, when it comes to 3-D plots, the software leaves some things to be desired. The hidden line removal consumes vast amounts of virtual
memory. When I tried to plot one of the coefficients surfaces with the x and z axes switched, it ran out of memory on a Windows NT system with 256K of virtual memory. Also, the surface would be much easier to understand if it could be colored with a spectrum.
If you know of a better 3D plotting package that runs on Windows NT, please drop me a note.
I have also had a hard time getting gnuplot to generate 2-D plots with multiple lines that have different colors. I have succeeded in doing this only when the data for each line was in a separate file, which can be awkward.
ROOT: An Object Oriented Data Analysis Framework
I was sent the reference to Root by a physicist, Costas A. Root is a data analysis framework that is targeted at the massive amounts of data generated by high energy physics experiments at CERN and elsewhere.
Although Root leans heavily toward physics, it looks to me like Root would be useful in other areas. Some of the statistical techniques that are used to analyze results in experimental physics is also used in quantitive finance, for example.
Root has different goals than gnuPlot. It is targeted at a much more challenging data analysis enviroment (terabytes of data). But it has a large learning curve and I'm skeptical if it can be easily used by those who do not have a sophisticated command of C++.
In contrast gnuPlot is a simple plotting environment. So my search for a better plotting environment continues. I know that such environments are supported by Matlab and Mathematics, but these packages are too expensive for my limited software budget.
References
Books
Ripples in Mathematics: the Discrete Wavelet Transform by Jensen and la Cour-Harbo, 2001So far this is the best book I've found on wavelets. I read this book after I had spent months reading many of the references that follow, so I'm not sure how easy this book would be for someone with no previous exposure to wavelets. But I have yet to find
any "easy" reference. Ripples in Mathematics covers Lifting Scheme wavelets which are easier to implement and understand. The book is written
at a relatively introductory level and is aimed at engineers. The authors provide implementations for a number of wavelet algorithms. Ripples also
covers the problem of applying wavelet algorithms like Daubechies D4 to finite data sets (e.g., they cover some solutions for the edge problems encountered for Daubechies wavelets).
Wavelets and Filter Banks by Gilbert Strang and Truong Nguyen, Wellesley Cambridge Pr, 1996
A colleague recommend this book, although he could not load it to me since it is packed away in a box. Sadly this book is hard to find. I bought my copy via abebooks.com, used, from a book dealer in Australia. While I was waiting for the book I read a few of
Gilbert Strang's journal articles. Gilbert Strang is one of the best writers I've encountered in mathematics. I have only just started working through this book, but it looks like an excellent, although mathematical, book on wavelets.
Wavelets Made Easy by Yves Nievergelt, Birkhauser, 1999
This books has two excellent chapters on Haar wavelets (Chapter 1 covers 1-D Haar wavelets and Chapter 2 covers 2-D wavelets). At least in his coverage of Haar wavelts, Prof. Nievergelt writes clearly and includes plenty of examples. The coverage of Haar wavelets
uses only basic mathematics (e.g., algebra).
Following the chapter on Haar wavelets there is a chapter on Daubechies wavelets. Daubechies wavelets are derived from a general class of wavelet transforms, which includes Haar wavelets. Daubechies wavelets are better for smoothly changing time series, but
are probably overkill for financial time series. As Wavelets Made Easy progresses, it gets less easy. Following the chapter on Daubechies wavelets
is a discussion of Fourier transforms. The later chapters delve into the mathematics behind wavelets. Prof. Nievergelt pretty much left me behind at the chapter on Fourier transforms. For an approachable discussion of Fourier transforms, see Understanding
Digital Signal Processing by Richard G. Lyons (below).
As Wavelets Made Easy progresses, it becomes less and less useful for wavelet algorithm implementation. In fact, while the mathematics Nievergelt
uses to describe Daubechies wavelets is correct, the algorithm he describes to implement the Daubechies transform and inverse transform seems to be wrong.
Wavelets Made Easy does not live up to the "easy" part of its title. Given this and the apparent errors in the Daubechies coverage, I am sorry
to say that I can't recommend this book. Save your money and buy a copy of Ripples in Mathematics.
Discovering Wavelets by Edward Aboufadel and Steven Schlicker
At 125 pages, this is one of the most expensive wavelet books I've purchased, on a per page basis. It sells on Amazon for
$64.95 US. I bought it used for $42.50.
If Discovering Wavelets provided a short, clear description of wavelets, the length would be a virtue, not a fault. Sadly this is not the case. Discovering
Waveletsseems to be a book written for college students who have completed calculus and linear algebra. The book is heavy on theorms (which are incompletely explained) and very sort on useful explaination. I found the description of wavelets unnecessarily
obscure. For example, Haar wavelets are described in terms of linear algebra. They can be much more simply described in terms of sums, differences and the so called pyramidal algorithm.
While Discovering Wavelets covers some important material, its coverage is so obscure and cursory that I found the book useless. The book resembles
a set of lecture notes and is of little use without the lecture (for their student's sake I hope that Aboufadel and Schlicker are better teachers than writers). This is a book that I wish I had not purchased.
Wavelet Methods for Time Series Analysis by Donald B. Percival and Andrew T. Walden, Cambridge University Press, 2000
I'm not a mathematician and I don't play one on television. So this book is heavy going for me. Never the less, this is a good book. For someone with a better mathematical background this might be an excellent book. The authors provide a clear discussion of
wavelets and a variety of time series analsysis techniques. Unlike some mathematicians, Percival and Walden actually coded up the wavelet algorithms and understand the difficulties of implementation. They compare various wavelet families for various applications
and chose the simplest one (Haar) in some cases.
One of the great benifits of Wavelet Methods for Time Series Analysis is that it provides a clear summary of a great deal of the recent research.
But Percival and Walden put the research in an applied context. For example Donoho and Johnstone published an equation for wavelet noise reduction. I have been unable to find all of their papers on the Web and I have never understood how to calculate some
of the terms in the equation in practice. I found this definition in Wavelet Methods.
The World According to Wavelets: The Story of a Mathematical Technique in the Making by Barbara Burke Hubbard, A.K. Peters, 1996
This book provides an interesting history of the development of wavelets. This includes sketches of many of the people involved in pioneering the application and mathematical theory behind wavelets. Although Ms. Hubbard makes a heroic effort, I found the explaination
of wavelets difficult to follow.
The Cartoon Guide To Statistics by Larry Gonic and Woollcott Smith, Harper Collins
I work with a number of mathematicians, so it's a bit embarrassing to have this book on my disk. I never took statistics. In college everyone I knew who took statistics didn't like it. Since it was not required for my major (as calculus was), I did not take
statistics. I've come to understand how useful statistics is. I wanted to filter out Gaussian noise, so I needed to understand normal curves. Although the title is a bit embarrassing, The
Cartoon Guide to Statistics provided a very rapid and readable introduction to statistics.
Understanding Digital Signal Processing by Richard G. Lyons.
This book is fantastic. Perhaps the best introductory book ever written on digital signal processing. It is the[/u] book on signal processing for software
engineers like myself with tepid mathematical backgrounds. It provides the best coverage I've ever seen on DFTs and FFTs. In fact, this book has inspired me to try FFTs
on financial time series (an interesting experiment, but wavelets produce better results and Fourier transforms on non-stationary time series).
See my web page A Notebook Compiled While Reading Understanding
Digital Signal Processing by Lyons
Web based references
My web page on the wavelet LiftingScheme. The Haar wavelet algorithm expressed using the wavelet Lifting Scheme is considerably simpler than the algorithm referenced above. The Lifting Scheme also allows Haar wavelet to be extended into a wavelet algorithms that have perfect reconstruction
and have better multiscale resolution than Haar wavelets.
Haar Wavelet Transform by Emil Mikulic
Emil Mikulic has published a simple explaination of the Haar transform, for both 1-D and 2-D data. For those who find my explaination obscure, this might be a good resource.
The
Wavelet Tutorial: The Engineer's Ultimate Guide to Wavelet Analysis, by Robi Polikar.
The "ultimate guide" to wavelet analysis has yet to be written, at least for my purposes. But Prof. Polikar's Wavelet Tutorial is excellent. When
it comes to explaining Wavelets and Fourier transforms, this is one of the best overviews I've seen. Prof. Polikar put a great deal of work into this tutorial and I am greateful for his effort. However, there was not sufficient detail in this tutorial to allow
me to create my own wavelet and inverse wavelet tranform software.
A Really Friendly Guide to Wavelets
This Web page (which is also available in PDF) provides a nice overview of the theory behind wavelets. But as with Robi Polikar's web page, its a big step from this material to a software implementation. Whether this Web page is "really friendly" depends on
who your friends are. If you friends are calculus and taylor series, then this paper is for you. After working my way through a good part of Wavelets
Made Easy this paper filled in some hole for me. But I would not have understood it if I had read it before Wavelets Made Easy.
Bell Labs Wavelets Group Home Page
Wim Sweldens, who has published a lot of material on the Web (he is the editor of Wavelet
Digest) and elsewhere on Wavelets is a member of this group. An interesting site with lots of great links to other web resources.
See also Wim Swelden's Wavelet Cascade Java
Applet
Lifting Scheme Wavelets
Win Sweldens and Ingrid Daubechies invented a new wavelet technique known as the lifting scheme. Gabriel Fernandez has published an excellent
bibliography on the lifting scheme wavelets which can be found here.
This bibliography has a pointer to Wim Sweldens' and Peter Schroder's lifting scheme tutorial Building Your Own Wavelets at Home.
Clemens Valens has written a tutorial on
the fast lifting wavelet transform. This is a rather mathematically oriented tutorial. For many, Wim Sweldens' paper Building Your Ownh Wavlets at
Home may be easier to under stand (although I still found this paper heavy going).
Gabriel Fernandez has developed LiftPack. The LiftPack
Home Page publishes the LiftPack software. The bibliography is a sub-page of the LiftPack Home page.
See also my web page on The Wavelet
Lifting Scheme.
Wavelets in Computer Graphis
One of the papers referenced in Gabriel Fernandez's lifting scheme bibliography is Wim Sweldens and Peter Schroder's paper Building
Your Own Wavelets at Home. This is part of a course on Wavelets
in Computer Graphics given at SigGraph 1994, 1995 and 1996. The sigGraph course coverd an amazing amount of material.Building Your Own Wavelets
at Home was apparently covered in a morning. There are a lot of mathematically gifted people in computer graphics. But even for these people, this looks like tough going for a morning. I've spent hours reading and rereading this tutorial before I understood
it enough to implement the polynomial interpolation wavelets that it discusses.
Wavelet Shrinkage (denoising)
D. Donoho Wavelet
Shrinkage and W.V.D. -- A Ten-Minute Tour, (figures),
1993.
D. Donoho De-Noising
By Soft-Thresholding, IEEE Trans. on Information Theory, Vol 41, No. 3, pp. 613-627, 1995.
D. Donoho Adapting
to Unknown Smoothness via Wavelet Shrinkage, JASA , 1995.
CalTech Multi-Resolution Modeling Group Publications
The Wavelets in Computer Graphics page, referenced above, is one of the links from the CalTech Multi-resolution
Modeling Group Publications web page. The wavelet publications referenced on this page concentrate on wavelet applications for computer graphics.
Tutorial on Continuous Wavelet Analysis of Experiemental
Data by Jacques Lewalle, Syracuse University.
This is yet another "introductory" tutorial by a mathematician. It gives a feeling for what you can do with wavelets, but there is not enough detail to understand the details of implementing wavelet code.
Amara's Wavelet Page
Amara Graps' web page provides some good basic introductory material on wavelets and some excellent links to other Web resources. There is also a link to the author's (Amara) IEEE
Computational Sciences and Engineering article on wavelets.
Wave++ from Ryerson Polytechnic University Computational Signals Analysis Group
Wave++ is a C++ class library for wavelet and signal
analysis. This library is provided in source form. I have not examined it in detail yet.
Wavelet and signal processing algorithms are usually fairly simple (they consist of a relatively small amount of code). My experience has been that the implementation of the algorithms is not as time consuming as understanding the algorithms and how they can
be applied. Since one of the best ways to understand the algorithms is to implement and apply them, I'm not sure how much leverage Wave++ provides unless you already understand wavelet algorithms.
Wavelet Compression Arrives by Peter Dyson, Seybold Reports,
April 1998.
This is an increasingly dated discussion on wavelet compression products, especially for images. The description of the compression products strengths and weaknesses is good, but the description of wavelets is poor.
Web page of Zbigniew R. Struzik
Prof. Zbigniew R. Struzik of Centrum voor Wiskunde en Informatica in the Netherlands has done some very interesting work with wavelets in a variety of areas, including data mining in finance. This web page has a link to Prof. Struzik's publications (at the
bottom of the Web page). Prof. Struzik's work also shows some interesting connections between fractals and wavelets.
Disclaimer
This web page was written on nights and weekends, using my computer resources. This Web page does not necessarily reflect the views of my employer (at the time this web page was written). Nothing published here should be interpreted as a reflection on any techniquesused by my employer (at that time).
Ian Kaplan, July 2001
Revised: February 2004

相关文章推荐
- Cannot modify header information错误解决方法
- php出现Cannot modify header information问题的解决方法大全
- Display SQL Server Version Information
- use jscript with List Proxy Server Information
- PHP错误Warning: Cannot modify header information - headers already sent by解决方法
- 小企业信息安全:基础(初稿)
- [转]浅析人脸检测之Haar分类器方法
- 个人调查表
- Haar-like特征
- haar特征
- 小波变换图像处理
- Haar-like特征
- 小波变换和motion信号处理(一)
- Matlab_Marr小波尺度变换图
- Matlab 图像小波变换
- 一维的Haar小波变换
- Adaboost应用系列之一:Opencv2.0中利用Adaboost训练Haar特征产生xml分类器
- 浅析人脸检测之Haar分类器方法:Haar特征、积分图、 AdaBoost 、级联
- 目标检测的图像特征提取之(三)Haar特征
- OpenCV编程->Haar训练(1)