Post-Mortem Debugging Your Application with Minidumps and Visual Studio .NET
2015-12-06 22:45
796 查看
http://www.codeproject.com/Articles/1934/Post-Mortem-Debugging-Your-Application-with-Minidu
This article describes how minidumps work, how to make your application create them when it crashes, and how to read them back with Visual Studio .NET.
Summary: If your application crashes at acustomer site, you can now debug it after the fact using minidumps and theMicrosoft® Visual Studio® NET debugger. This article describes how minidumps work, how to make your application create them
when it crashes, and how to read them back with Visual Studio .NET. Minidumps are key to theMicrosoft error reporting program to improve the reliability of the Windowsoperating system and applications such as Visual Studio .NET. This articlealso describes
how to use the Microsoft symbol server to automatically findsymbols for system components. This article assumes that you are familiar withWin32 and C++ programming.
Creating a Minidump
Build Issues
Writing a Minidump withMiniDumpWriteDump
Reading a Minidump with VisualStudio .NET
How Microsoft Uses Minidumps
Further Improvements
Conclusion
a fix.
Since the early days of Windows NT, the Dr. Watson program hasbeen able to generate crash dump files, denoted with the .dmp extension.However, they were not as useful as they should have been because of twoproblems:
They were huge. The dump of an application included every byteof the entire process space, so a crash in something simple like Notepad wouldbe several megabytes in size, and a crash in something like Word can be manyhundreds of megabytes. The files were
just too big to send by e-mail or FTP.
Their content was not necessarily useful. Dr. Watson was, infact, a just-in-time (JIT) debugger, and it is difficult for a debugger to getthe full path to a loaded module. Full debuggers such as the Visual Studiodebugger complete a number of steps to get
the paths, but Dr. Watson did not.This usually resulted in unhelpful module names such as MOD0000 and so on.
Minidumps were designed to fix these problems in a number ofways:
Instead of saving the entire process space, onlycertain sections are saved. There is no point in saving copies of modules suchas Kernel32.dll; if the version number is included, it is easy to get a copy froma Windows CD. The actual memory heap of the application
is by default not savedin a minidump; it is not required to debug a surprisingly high percentage ofcrashes. You can save the heap if you need to, however.
The minidump save code works to get accurate and fullinformation for modules, including their names, paths, version information, andinternal timestamps.
The minidump save code also gets the list of threads,their contexts (that is, register sets), and the memory behind their stacks.
The whole file is compressed, further reducing itssize. A minidump for Notepad is around 6K on Windows XP, almost 300 timessmaller than the previous crash dump of the same process.
Note Kernel-modeminidumps, which are generated by Windows XP after a computer stops responding,also exist, but this article discusses more common user-mode minidumps.
Add code to your own application to write a minidump ifthe application has an unhandled exception.
In the integrated development environment of VisualStudio .NET, click Save Dump on the Debug menu when debugging theapplication.
Do nothing.
The first option is discussed in more detail in the followingsections.
The second option works only on a workstation with the debuggeralready configured, which is likely useful only within an organization (forexample, with another developer or tester). If you debug a crash with VisualStudio .NET, you can then click Save Dump
As on the Debug menu. You cansave as a Minidump or Minidump With Heap. You do not need any symbols or PDBsconfigured to save a dump file; you will need them later, however, to read itback.
The third option works only in Windows XP, which automaticallycreates a minidump if an application has an unhandled exception and no JITdebugger has been set up. Also, the minidump is submitted directly toMicrosoft, so you will not have the opportunity to
determine why.
its matching PDB; youwill need the PDB later to debug any minidumps that your customers submit.
Also, ensure that you set the version information correctly onyour binaries. Every release of every component that you ship should have adifferent version, so you can match them to the minidump. The version fieldassists you in matching the bits. The debugger
itself does not use the versioninformation, however; it matches binaries based on the internal timestamp inthe PE header.
In terms of output, generating debug information for releasebuilds has a small effect. A PDB, taking up some space on a build machine, isgenerated, and the binary will be a few hundred bytes larger, to record thename of the PDB in the debug directory within
the PE file. You should notprovide customers with the PDB; this could allow customers to more easilyreverse-engineer your application.
versions had problems with the API, andversions 5.0.x are from Windows 2000 and do not export the function. If youhave a version earlier than 5.0, then it comes from the Systems Debuggerpackage (including WinDbg and so on) and is not redistributable.
To call the API, you need to catch the crash by setting anunhandled exception handler with the
terminatethe application without calling the filter or a JIT debugger.
In your filter function, you must load Dbghelp.dll. This is notas simple as calling
into the samedirectory as the EXE; if this does not work, then the code reverts to a plain
After loading the DLL, it then checks for the named export; ifcorrect, it then creates a file with an appropriate name, such as saving to theTemp directory and using the application name with the .dmp extension. Thishandle is then passed to the API itself,
with some additional information suchas the process ID and the type of dump file. The sample uses
Minidump With Heap option in the Visual Studiodebugger. This does result in substantially larger dump files.
Once the .dmp file is created, the application informs the userwhere it is stored. The user can then e-mail it or use FTP to get you the fileto investigate.
To use the sample code provided, add the mdump.h file and declareone
Dbghelp.dll file in thesame directory as the EXE to run successfully.
You cannot debug the code that writes the minidump with adebugger (in the sample code,
Start Visual Studio .NET and, on the File menu, click OpenSolution. Change the Files of type drop-down menu to Dump Files (*.dmp;*.mdmp), navigate to the minidump, and create a default project by clickingOpen.
To launch the dump with the debugger, press F5. This will provideyou with information to get started. The debugger creates a fake process; inthe Output window, various module load messages are displayed. The debugger isrecreated the crashed processes state
only. After displaying a warning that theEXE contains no debug information, the debugger stops with the user's crash,such as an access violation. If you then examine the Call Stack window, youwill notice the lack of symbols and a lack of useful information.
To read a minidump, you typically need copies of the binariesinvolved. To find the right binaries, open the Modules window.
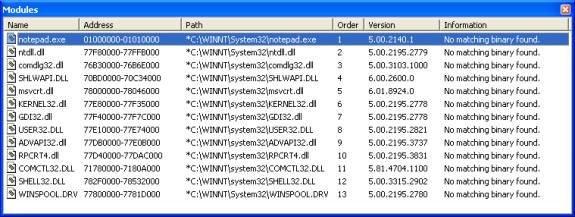
Figure 2 shows the Notepad example and demonstrates two things.First, the paths to the binaries are marked with asterisks, which denotes thepath on the user's workstation but the binary could not be found at thatlocation on your machine. Second, the messages
read “No matching binary found”in the Information field. The key to finding matching binaries is to look atthe Version field and the file name. In this example, the version of mostsystem files is 2195, which indicates Windows 2000. It does not immediatelyindicate
the exact service pack (SP) or quality fix engineering (QFE), however.For more information, see the DLL Help database at
http://support.microsoft.com/servicedesks/fileversion/dllinfo.asp.
At this point, you will need to find a Windows operating systemCD or a user's workstation with the correct versions and copy the correctversions into a directory. It is not normally necessary to find every binarythat was in the process, but it is important
to find each binary that featureson every relevant call stack. This will often involve both operating systembinaries (such as Kernel32.dll) and your application binaries (in this example,Notepad.exe).
When you have found the bits and copied them to a localdirectory, on the Debug menu, click Stop Debugging. In Solution Explorer,right-click the project icon and click Properties on the shortcut menu. Thiswill take you to the Debugging page. Fill in the Command
Arguments to beMODPATH, followed by an equal sign, and followed by a semicolon-delimited listof places to look for binaries. In this example, it is:
Hide Copy Code
After setting the path, press F5 to reload the minidump. MODPATHreuses the command argument to get the value to the debugger; a future versionof Visual Studio .NET may have a better way of setting this, perhaps as anoption in the Properties dialog box.
Although finding the binaries is unlikely to improve the callstack, it should resolve some issues in the Modules window, as shown in Figure3.
Instead of saying “No matching binary found”, it now says acombination of “Cannot find or open a required DBG file” or “No symbolsloaded”. The first message occurs with system DLLs that use DBGs for theirdebugging information. The second message occurs for
DLLs that use PDBs.Getting matching binaries will not necessarily improve your call stack; youalso need debug information that matches them.
The best place to locate system symbols is at http://www.microsoft.com/ddk/debugging.You can also locate system symbols on the Support compact disc that ships withWindows NT Server and Windows 2000 Server operating systems. In this example,they were copied to the location of the binaries. In real instances,
you willhave non-Microsoft binaries listed, so you will need to have PDBs for them.Also in this example, the DBG and PDB for Notepad were also copied, because itwas the sample application used.
After you click Stop Debugging on the Debug menu, pressing F5will list a call stack, as shown in Figure 4. You may find that, as you add newbinaries and debug information, your call stack will change. This is to beexpected; a call stack can only be walked
accurately with debug information, soas you add more information, your stack will get more accurate, which willoften expose additional frames that were not in the original.
In this example, there was no crash. In real instances, you wouldhave sufficient information to determine the cause of around 70 percent of youruser crashes. In addition, this stack was created with the stripped symbolsthat Microsoft ships for system component,
so there was no line numberinformation. For your own binaries with full PDBs, you will get an even richerstack.
but was extended to supportfinding binary files. The Windows NT debugger was the first tool to supportthis, but Visual Studio .NET also does so as an undocumented feature. Formore information on symbol server, see
http://www.microsoft.com/ddk/debugging/symbols.asp.
You can also retrieve symbols from the Microsoft symbol server.These symbols will be cached and indexed locally for you.
copiedSymsrv.dll, you can safely uninstall the debugging tools. You will also need tomake a local directory. For this example, create a local directory asC:\localstore.
In the Project Properties dialog box, set the Symbol Path on theDebugging page to:
Hide Copy Code
This string tells the debugger to use the symbol server to getsymbols and create a local symbol server, where they will be copied. Now, whenyou press F5 on the minidump, the symbols are copied from the Microsoft Website, copied to the local store, and then
used by the debugger. After the firsttime you do this, your performance will be quicker, because they will beretrieved from the local store rather than from the Web.
When debugging a non-Microsoft application, you should use acombination of methods A and B. Use A to get the system components and addpaths to your bits and symbols by separating them with semicolons, such as:
Hide Copy Code
Because the symbol server is an undocumented feature of Visual Studio .NET,there is no error reporting. If the syntax is incorrect or Symsrv.dll is not onthe path, the symbols will fail to load with the error "No symbolsloaded". You can also use symbol servers
to store and retrieve binaries,but the MODPATH syntax needs to use symsrv*symsrv.dll*instead of SRV*.
Note The Microsoftsymbol server does not contain binary files, but any symbol servers that youcreate can.
Symbol servers work for "live" debugging, as well, notonly for minidumps. To do this, you will need to set the Symbol Path on theDebugging page properly.
responding, creates a minidump,and asks the user if he or she wants to submit the information to Microsoft.
If the user clicks Send Error Report, then Dr. Watson creates andsubmits the minidump to a server on the Microsoft Web site. The utilityperforms the user prompting and minidump saving in a different process, whichis spawned from the crashing process. This
places less demand on the crashedapplication, increasing the chances of getting a valid minidump from the user.
receive the actual minidumps of thecrashes for further investigation. In some cases where the crash is fullyunderstood, users are automatically directed to a Web page that containsinformation about a known workaround or contains a fix to correct the problem.Since
the release of Internet Explorer 5.5 and Office XP, many other productteams use similar technology to gather crash information. It is also a standardpart of Windows XP.
The sample discussed in this article provides a basis forunderstanding minidumps. The sample does not discuss retrieving the dump filefrom the user. In the simplest case, the user can be prompted to send theminidump by e-mail. Also, potential privacy issues
can occur, because user datamay be present on the stack and is guaranteed to be present in a minidump thatincludes the full heap. This should be made clear to users. The Microsoft datacollection policy, which also contains additional information about the
exactcontents of minidumps, is at http://watson.microsoft.com/dw/1033/dcp.asp.
In addition, the creation of minidumps from a Windows servicethat has an unhandled exception poses additional challenges, to do with desktopaccess (for example, if no one is using the console, then you cannot promptthem) and security contexts.
and allow thedeveloper to debug the problem. Symbol server can be used to make it mucheasier to find system symbols to aid in this analysis.
A list of licenses authors might use can be found
here
This article describes how minidumps work, how to make your application create them when it crashes, and how to read them back with Visual Studio .NET.
Summary: If your application crashes at acustomer site, you can now debug it after the fact using minidumps and theMicrosoft® Visual Studio® NET debugger. This article describes how minidumps work, how to make your application create them
when it crashes, and how to read them back with Visual Studio .NET. Minidumps are key to theMicrosoft error reporting program to improve the reliability of the Windowsoperating system and applications such as Visual Studio .NET. This articlealso describes
how to use the Microsoft symbol server to automatically findsymbols for system components. This article assumes that you are familiar withWin32 and C++ programming.
Contents
What Is a Minidump?Creating a Minidump
Build Issues
Writing a Minidump withMiniDumpWriteDump
Reading a Minidump with VisualStudio .NET
How Microsoft Uses Minidumps
Further Improvements
Conclusion
What Is a Minidump?
A minidump is a file containing the most important parts of acrashed application. It is written on the user’s machine and then the customercan submit it to the developer. The developer can load the dump to helpdetermine the cause of the crash and developa fix.
Since the early days of Windows NT, the Dr. Watson program hasbeen able to generate crash dump files, denoted with the .dmp extension.However, they were not as useful as they should have been because of twoproblems:
They were huge. The dump of an application included every byteof the entire process space, so a crash in something simple like Notepad wouldbe several megabytes in size, and a crash in something like Word can be manyhundreds of megabytes. The files were
just too big to send by e-mail or FTP.
Their content was not necessarily useful. Dr. Watson was, infact, a just-in-time (JIT) debugger, and it is difficult for a debugger to getthe full path to a loaded module. Full debuggers such as the Visual Studiodebugger complete a number of steps to get
the paths, but Dr. Watson did not.This usually resulted in unhelpful module names such as MOD0000 and so on.
Minidumps were designed to fix these problems in a number ofways:
Instead of saving the entire process space, onlycertain sections are saved. There is no point in saving copies of modules suchas Kernel32.dll; if the version number is included, it is easy to get a copy froma Windows CD. The actual memory heap of the application
is by default not savedin a minidump; it is not required to debug a surprisingly high percentage ofcrashes. You can save the heap if you need to, however.
The minidump save code works to get accurate and fullinformation for modules, including their names, paths, version information, andinternal timestamps.
The minidump save code also gets the list of threads,their contexts (that is, register sets), and the memory behind their stacks.
The whole file is compressed, further reducing itssize. A minidump for Notepad is around 6K on Windows XP, almost 300 timessmaller than the previous crash dump of the same process.
Note Kernel-modeminidumps, which are generated by Windows XP after a computer stops responding,also exist, but this article discusses more common user-mode minidumps.
Creating a Minidump
There are three ways to create a minidump:Add code to your own application to write a minidump ifthe application has an unhandled exception.
In the integrated development environment of VisualStudio .NET, click Save Dump on the Debug menu when debugging theapplication.
Do nothing.
The first option is discussed in more detail in the followingsections.
The second option works only on a workstation with the debuggeralready configured, which is likely useful only within an organization (forexample, with another developer or tester). If you debug a crash with VisualStudio .NET, you can then click Save Dump
As on the Debug menu. You cansave as a Minidump or Minidump With Heap. You do not need any symbols or PDBsconfigured to save a dump file; you will need them later, however, to read itback.
The third option works only in Windows XP, which automaticallycreates a minidump if an application has an unhandled exception and no JITdebugger has been set up. Also, the minidump is submitted directly toMicrosoft, so you will not have the opportunity to
determine why.
Build Issues
To configure your application to create dumps when it stopsresponding, you must configure your builds to generate full debugginginformation, especially for retail builds. After generating a PDB, you alsomust archive every binary that ships to customers andits matching PDB; youwill need the PDB later to debug any minidumps that your customers submit.
Also, ensure that you set the version information correctly onyour binaries. Every release of every component that you ship should have adifferent version, so you can match them to the minidump. The version fieldassists you in matching the bits. The debugger
itself does not use the versioninformation, however; it matches binaries based on the internal timestamp inthe PE header.
In terms of output, generating debug information for releasebuilds has a small effect. A PDB, taking up some space on a build machine, isgenerated, and the binary will be a few hundred bytes larger, to record thename of the PDB in the debug directory within
the PE file. You should notprovide customers with the PDB; this could allow customers to more easilyreverse-engineer your application.
Writing a Minidump with MiniDumpWriteDump
The key API to saving a minidump isMiniDumpWriteDump,which is exported from Dbghelp.dll, a redistributable DLL that comes with thePlatform SDK. Make sure that you are using the Windows XP version 5.1.2600;earlier beta and release candidate
versions had problems with the API, andversions 5.0.x are from Windows 2000 and do not export the function. If youhave a version earlier than 5.0, then it comes from the Systems Debuggerpackage (including WinDbg and so on) and is not redistributable.
To call the API, you need to catch the crash by setting anunhandled exception handler with the
SetUnhandledExceptionFilterAPI. This allows the filter function to be called at almost any time anunhandled exception occurs in an application. In certain unhandled exceptions,such as a double stack fault, the operating system will immediately
terminatethe application without calling the filter or a JIT debugger.
In your filter function, you must load Dbghelp.dll. This is notas simple as calling
LoadLibrary; as with Windows 2000,you will access the one from the System32 directory, which does not have theright export. The sample code in the attached file tries to load from the samelocation as the EXE. Install the correct version of Dbghelp.dll
into the samedirectory as the EXE; if this does not work, then the code reverts to a plain
LoadLibrary, which will only work if the application isrunning on Windows XP.
After loading the DLL, it then checks for the named export; ifcorrect, it then creates a file with an appropriate name, such as saving to theTemp directory and using the application name with the .dmp extension. Thishandle is then passed to the API itself,
with some additional information suchas the process ID and the type of dump file. The sample uses
MiniDumpNormal. You may want to or-in the flagvalue of MiniDumpWithDataSegs, which is the equivalentto the
Minidump With Heap option in the Visual Studiodebugger. This does result in substantially larger dump files.
Once the .dmp file is created, the application informs the userwhere it is stored. The user can then e-mail it or use FTP to get you the fileto investigate.
To use the sample code provided, add the mdump.h file and declareone
MiniDumperobject at global scope. Its constructortakes an argument, which should be the basename of the minidump file. Addmdump.cpp to your project. You need to have the correct
Dbghelp.dll file in thesame directory as the EXE to run successfully.
You cannot debug the code that writes the minidump with adebugger (in the sample code,
Minidumper::TopLevelFilter).If a debugger is attached to a process, then the unhandled exception filterwill never be called. If you encounter problems, you will need to useMessageBox debugging.
Readinga Minidump with Visual Studio .NET
This section uses an example of a manually created minidump fromNotepad in Windows 2000 and debugging in Windows XP.Start Visual Studio .NET and, on the File menu, click OpenSolution. Change the Files of type drop-down menu to Dump Files (*.dmp;*.mdmp), navigate to the minidump, and create a default project by clickingOpen.
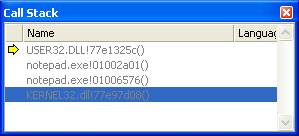
To launch the dump with the debugger, press F5. This will provideyou with information to get started. The debugger creates a fake process; inthe Output window, various module load messages are displayed. The debugger isrecreated the crashed processes state
only. After displaying a warning that theEXE contains no debug information, the debugger stops with the user's crash,such as an access violation. If you then examine the Call Stack window, youwill notice the lack of symbols and a lack of useful information.
Figure 1. Initial Stack with No Symbols
To read a minidump, you typically need copies of the binariesinvolved. To find the right binaries, open the Modules window.
Figure 2. Initial Modules with No Binaries
Figure 2 shows the Notepad example and demonstrates two things.First, the paths to the binaries are marked with asterisks, which denotes thepath on the user's workstation but the binary could not be found at thatlocation on your machine. Second, the messages
read “No matching binary found”in the Information field. The key to finding matching binaries is to look atthe Version field and the file name. In this example, the version of mostsystem files is 2195, which indicates Windows 2000. It does not immediatelyindicate
the exact service pack (SP) or quality fix engineering (QFE), however.For more information, see the DLL Help database at
http://support.microsoft.com/servicedesks/fileversion/dllinfo.asp.
At this point, you will need to find a Windows operating systemCD or a user's workstation with the correct versions and copy the correctversions into a directory. It is not normally necessary to find every binarythat was in the process, but it is important
to find each binary that featureson every relevant call stack. This will often involve both operating systembinaries (such as Kernel32.dll) and your application binaries (in this example,Notepad.exe).
When you have found the bits and copied them to a localdirectory, on the Debug menu, click Stop Debugging. In Solution Explorer,right-click the project icon and click Properties on the shortcut menu. Thiswill take you to the Debugging page. Fill in the Command
Arguments to beMODPATH, followed by an equal sign, and followed by a semicolon-delimited listof places to look for binaries. In this example, it is:
Hide Copy Code
MODPATH=m:\sysbits
After setting the path, press F5 to reload the minidump. MODPATHreuses the command argument to get the value to the debugger; a future versionof Visual Studio .NET may have a better way of setting this, perhaps as anoption in the Properties dialog box.
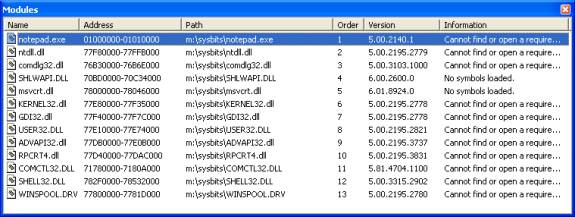
Although finding the binaries is unlikely to improve the callstack, it should resolve some issues in the Modules window, as shown in Figure3.
Figure 3. Modules with Binaries
Instead of saying “No matching binary found”, it now says acombination of “Cannot find or open a required DBG file” or “No symbolsloaded”. The first message occurs with system DLLs that use DBGs for theirdebugging information. The second message occurs for
DLLs that use PDBs.Getting matching binaries will not necessarily improve your call stack; youalso need debug information that matches them.
Method A: Symbols the Hard Way
To completely analyze a minidump, you should find debuginformation for everything, but to save time, you can find only the informationyou need. The example stack lists User32.dll and Kernel32.dll, so they needmatching debug information.Matching Debug Information
| Operating system | Files required |
| Windows NT 4 | DBGs |
| Windows 2000 | DBGs, PDBs |
| Windows XP | PDBs |
you willhave non-Microsoft binaries listed, so you will need to have PDBs for them.Also in this example, the DBG and PDB for Notepad were also copied, because itwas the sample application used.
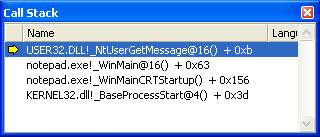
After you click Stop Debugging on the Debug menu, pressing F5will list a call stack, as shown in Figure 4. You may find that, as you add newbinaries and debug information, your call stack will change. This is to beexpected; a call stack can only be walked
accurately with debug information, soas you add more information, your stack will get more accurate, which willoften expose additional frames that were not in the original.
In this example, there was no crash. In real instances, you wouldhave sufficient information to determine the cause of around 70 percent of youruser crashes. In addition, this stack was created with the stripped symbolsthat Microsoft ships for system component,
so there was no line numberinformation. For your own binaries with full PDBs, you will get an even richerstack.
Figure 4. Call Stack with Symbols and Binaries
Symbol Servers
If you are dealing with many minidumps and performing generaldebugging, storing and accessing all the binary and PDB/DBG files can bedifficult. Windows NT developed a technology known as a symbol server, whichwas originally conceived as storage for symbolsbut was extended to supportfinding binary files. The Windows NT debugger was the first tool to supportthis, but Visual Studio .NET also does so as an undocumented feature. Formore information on symbol server, see
http://www.microsoft.com/ddk/debugging/symbols.asp.
You can also retrieve symbols from the Microsoft symbol server.These symbols will be cached and indexed locally for you.
Method B: Symbols The Easy Way: Using Symbol Server
First, go to http://www.microsoft.com/ddk/debugging anddownload the debugging tools. You need Symsrv.dll, which needs to be on thepath. You can either copy it next to devenv.exe or into your System32directory, to allow Visual Studio .NET access to it. Once you havecopiedSymsrv.dll, you can safely uninstall the debugging tools. You will also need tomake a local directory. For this example, create a local directory asC:\localstore.
In the Project Properties dialog box, set the Symbol Path on theDebugging page to:
Hide Copy Code
SRV*c:/localstore*http://msdl.microsoft.com/download/symbols
This string tells the debugger to use the symbol server to getsymbols and create a local symbol server, where they will be copied. Now, whenyou press F5 on the minidump, the symbols are copied from the Microsoft Website, copied to the local store, and then
used by the debugger. After the firsttime you do this, your performance will be quicker, because they will beretrieved from the local store rather than from the Web.
When debugging a non-Microsoft application, you should use acombination of methods A and B. Use A to get the system components and addpaths to your bits and symbols by separating them with semicolons, such as:
Hide Copy Code
c:\drop\build\myapp;SRV*c:\localstore*http://msdl.microsoft.com/download/symbols
Because the symbol server is an undocumented feature of Visual Studio .NET,there is no error reporting. If the syntax is incorrect or Symsrv.dll is not onthe path, the symbols will fail to load with the error "No symbolsloaded". You can also use symbol servers
to store and retrieve binaries,but the MODPATH syntax needs to use symsrv*symsrv.dll*instead of SRV*.
Note The Microsoftsymbol server does not contain binary files, but any symbol servers that youcreate can.
Symbol servers work for "live" debugging, as well, notonly for minidumps. To do this, you will need to set the Symbol Path on theDebugging page properly.
HowMicrosoft Uses Minidumps
Microsoft has been using minidumps to improve the quality of itsapplications for more than a year. Microsoft Internet Explorer 5.5 andMicrosoft Office XP were the first products to ship with the new Dr. Watson, autility that catches when an application stopsresponding, creates a minidump,and asks the user if he or she wants to submit the information to Microsoft.
If the user clicks Send Error Report, then Dr. Watson creates andsubmits the minidump to a server on the Microsoft Web site. The utilityperforms the user prompting and minidump saving in a different process, whichis spawned from the crashing process. This
places less demand on the crashedapplication, increasing the chances of getting a valid minidump from the user.
Further Improvements
On the server side, the minidumps are analyzed into areas ofsimilar crashes, based on where the crash occurred and in what component. Thisgives product teams statistics of how often the application crashed and howoften a given crash occurs. The teams alsoreceive the actual minidumps of thecrashes for further investigation. In some cases where the crash is fullyunderstood, users are automatically directed to a Web page that containsinformation about a known workaround or contains a fix to correct the problem.Since
the release of Internet Explorer 5.5 and Office XP, many other productteams use similar technology to gather crash information. It is also a standardpart of Windows XP.
The sample discussed in this article provides a basis forunderstanding minidumps. The sample does not discuss retrieving the dump filefrom the user. In the simplest case, the user can be prompted to send theminidump by e-mail. Also, potential privacy issues
can occur, because user datamay be present on the stack and is guaranteed to be present in a minidump thatincludes the full heap. This should be made clear to users. The Microsoft datacollection policy, which also contains additional information about the
exactcontents of minidumps, is at http://watson.microsoft.com/dw/1033/dcp.asp.
In addition, the creation of minidumps from a Windows servicethat has an unhandled exception poses additional challenges, to do with desktopaccess (for example, if no one is using the console, then you cannot promptthem) and security contexts.
Conclusion
Minidumps are a new technology to port-mortem debug crashes onuser workstations. It is easy to add code to existing applications toautomatically create them when an unhandled exception occurs. VisualStudio .NET can easily read them back to recreate the crashand allow thedeveloper to debug the problem. Symbol server can be used to make it mucheasier to find system symbols to aid in this analysis.
License
This article has no explicit license attached to it but may contain usage terms in the article text or the download files themselves. If in doubt please contact the author via the discussion board below.A list of licenses authors might use can be found
here
//------------- mdump.h ---------------
#if _MSC_VER < 1300
#define DECLSPEC_DEPRECATED
// VC6: change this path to your Platform SDK headers
#include "M:\\dev7\\vs\\devtools\\common\\win32sdk\\include\\dbghelp.h"			// must be XP version of file
#else
// VC7: ships with updated headers
#include "dbghelp.h"
#endif

// based on dbghelp.h
typedef BOOL (WINAPI *MINIDUMPWRITEDUMP)(HANDLE hProcess, DWORD dwPid, HANDLE hFile, MINIDUMP_TYPE DumpType,
CONST PMINIDUMP_EXCEPTION_INFORMATION ExceptionParam,
CONST PMINIDUMP_USER_STREAM_INFORMATION UserStreamParam,
CONST PMINIDUMP_CALLBACK_INFORMATION CallbackParam
);

class MiniDumper
{
private:
static LPCSTR m_szAppName;

static LONG WINAPI TopLevelFilter( struct _EXCEPTION_POINTERS *pExceptionInfo );

public:
MiniDumper( LPCSTR szAppName );
};

//---------------  mdump.cpp -------------------
#include "stdafx.h"

#include "mdump.h"

LPCSTR MiniDumper::m_szAppName;

MiniDumper::MiniDumper( LPCSTR szAppName )
{
// if this assert fires then you have two instances of MiniDumper
// which is not allowed
assert( m_szAppName==NULL );

m_szAppName = szAppName ? strdup(szAppName) : "Application";

::SetUnhandledExceptionFilter( TopLevelFilter );
}

LONG MiniDumper::TopLevelFilter( struct _EXCEPTION_POINTERS *pExceptionInfo )
{
LONG retval = EXCEPTION_CONTINUE_SEARCH;
HWND hParent = NULL;						// find a better value for your app

// firstly see if dbghelp.dll is around and has the function we need
// look next to the EXE first, as the one in System32 might be old
// (e.g. Windows 2000)
HMODULE hDll = NULL;
char szDbgHelpPath[_MAX_PATH];

if (GetModuleFileName( NULL, szDbgHelpPath, _MAX_PATH ))
{
char *pSlash = _tcsrchr( szDbgHelpPath, '\\' );
if (pSlash)
{
_tcscpy( pSlash+1, "DBGHELP.DLL" );
hDll = ::LoadLibrary( szDbgHelpPath );
}
}

if (hDll==NULL)
{
// load any version we can
hDll = ::LoadLibrary( "DBGHELP.DLL" );
}

LPCTSTR szResult = NULL;

if (hDll)
{
MINIDUMPWRITEDUMP pDump = (MINIDUMPWRITEDUMP)::GetProcAddress( hDll, "MiniDumpWriteDump" );
if (pDump)
{
char szDumpPath[_MAX_PATH];
char szScratch [_MAX_PATH];

// work out a good place for the dump file
if (!GetTempPath( _MAX_PATH, szDumpPath ))
_tcscpy( szDumpPath, "c:\\temp\\" );

_tcscat( szDumpPath, m_szAppName );
_tcscat( szDumpPath, ".dmp" );

// ask the user if they want to save a dump file
if (::MessageBox( NULL, "Something bad happened in your program, would you like to save a diagnostic file?", m_szAppName, MB_YESNO )==IDYES)
{
// create the file
HANDLE hFile = ::CreateFile( szDumpPath, GENERIC_WRITE, FILE_SHARE_WRITE, NULL, CREATE_ALWAYS,
FILE_ATTRIBUTE_NORMAL, NULL );

if (hFile!=INVALID_HANDLE_VALUE)
{
_MINIDUMP_EXCEPTION_INFORMATION ExInfo;

ExInfo.ThreadId = ::GetCurrentThreadId();
ExInfo.ExceptionPointers = pExceptionInfo;
ExInfo.ClientPointers = NULL;

// write the dump
BOOL bOK = pDump( GetCurrentProcess(), GetCurrentProcessId(), hFile, MiniDumpNormal, &ExInfo, NULL, NULL );
if (bOK)
{
sprintf( szScratch, "Saved dump file to '%s'", szDumpPath );
szResult = szScratch;
retval = EXCEPTION_EXECUTE_HANDLER;
}
else
{
sprintf( szScratch, "Failed to save dump file to '%s' (error %d)", szDumpPath, GetLastError() );
szResult = szScratch;
}
::CloseHandle(hFile);
}
else
{
sprintf( szScratch, "Failed to create dump file '%s' (error %d)", szDumpPath, GetLastError() );
szResult = szScratch;
}
}
}
else
{
szResult = "DBGHELP.DLL too old";
}
}
else
{
szResult = "DBGHELP.DLL not found";
}

if (szResult)
::MessageBox( NULL, szResult, m_szAppName, MB_OK );

return retval;
}

相关文章推荐
- Android自定义TextView省略号样式
- iOS-性能优化
- Android常用权限
- 编译错误jni/Android.mk:12: *** commands commence before first targe
- 1.创建Android项目-Google官网上的Android初学训练
- 自定义模拟+数字时钟,整合AnalogDigitalView
- 微信公众号自定义菜单添加emoji表情图标
- Android Studio apk 打包流程
- OTG – Android USB Hos
- 关于iOS地图定位中点击设置->隐私->定位服务 闪退问题
- IOS开发记录(二)
- Django搭建微信公众平台详解 一
- Android图片处理神器BitmapFun源码分析
- 从代码分析Android-Universal-Image-Loader的图片加载、显示流程
- IOS--文件存储
- Android从源码分析一:Looper,Handler消息机制
- Android Studio编译提速方法
- Android fork
- Android 初探OverScroller
- iOS调试常见错误 如:symbol(s) not found for architecture x86_64