ZendStudio调试配置(XDebug)
2015-11-10 19:58
603 查看
当前配置环境:
Win7 64bit
ZendStudio10.6.2(破解文件:http://download.csdn.net/download/xinzheng_wang/7643419)
Apache2.2.25(win32)
php-5.3.28 (线程安全,下载地址:http://windows.php.net/download/)
1)XDebug下载
XDebug可以到 http://xdebug.org/download.php 下载,可点击custom
installation instructions通过复制粘贴phpinfo()输出的内容得到需要下载的版本。
2)打开php.ini并在文件的最后增加如下配置,同时要重新启动Apache
[html] view
plaincopy


[XDebug]
;调试功能模块儿
;extension=php_xdebug-2.2.5-5.3-vc9.dll
zend_extension ="D:/PHP/php-5.3.28/ext/php_xdebug-2.2.5-5.3-vc9.dll"
xdebug.remote_handler=dbgp
;开启远程调试
xdebug.remote_enable = On
;远程主机
xdebug.remote_host=localhost
;主机端口
xdebug.remote_port=9000
;开启自动跟踪
xdebug.auto_trace = On
;开启异常跟踪
xdebug.show_exception_trace = On
;开启远程调试自动启动
xdebug.remote_autostart = On
;收集变量
xdebug.collect_vars = On
;收集返回值
xdebug.collect_return = On
;收集参数
xdebug.collect_params = On
;临时跟踪信息输出
;xdebug.trace_output_dir="d:/PHP/php-5.3.28/temp"
;显示局部变量
xdebug.show_local_vars = On
xdebug.profiler_enable = On
;xdebug.profiler_output_dir ="d:/PHP/php-5.3.28/temp"
xdebug.trace_enable_trigger =On
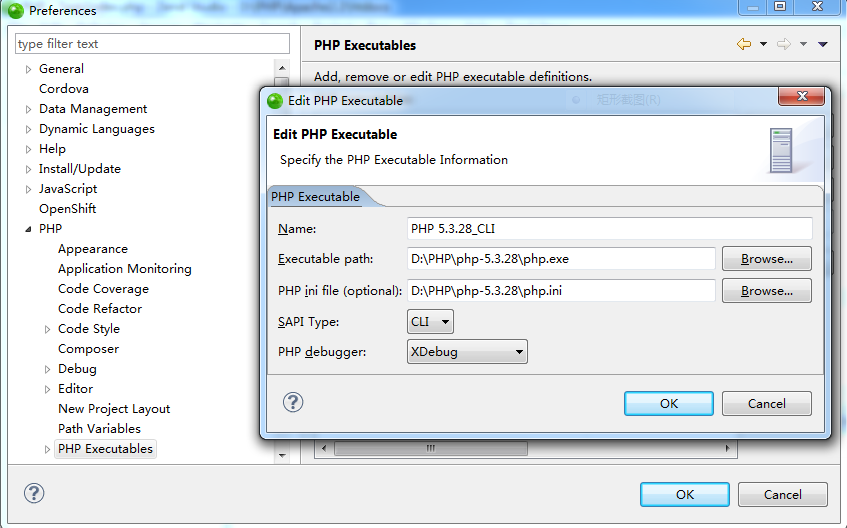
3)Window->Preferences->PHP Executable->Add如下:
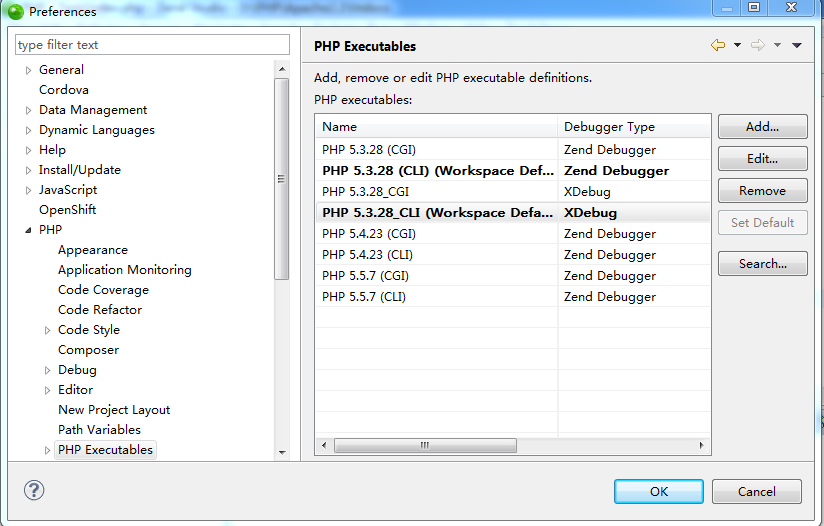
4)设为Default如下:
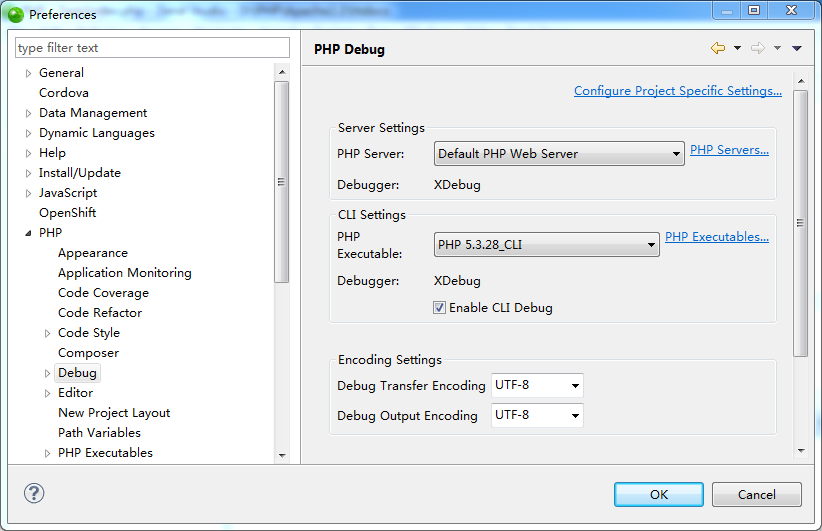
5)Debug设置如下:
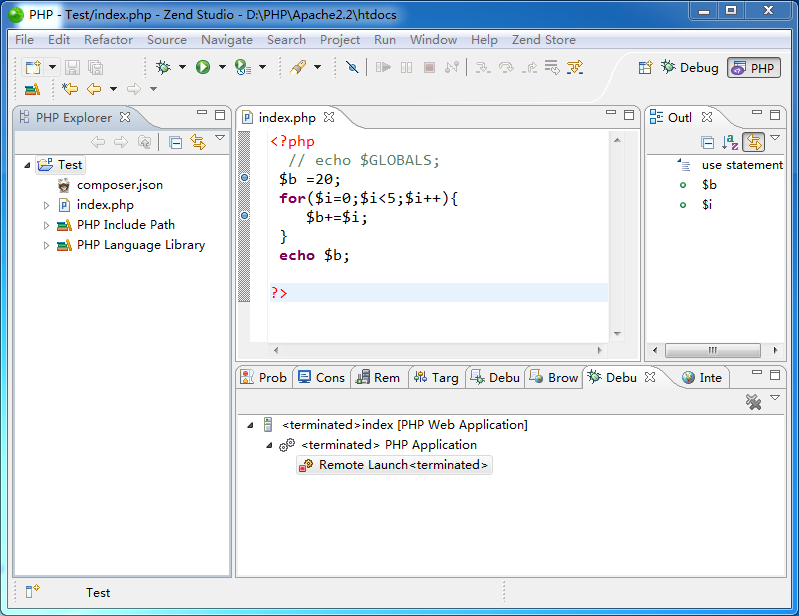
6)新Local PHP Project并增加断点如下:
7)右键点击工程,点击菜单Properties设置如下:
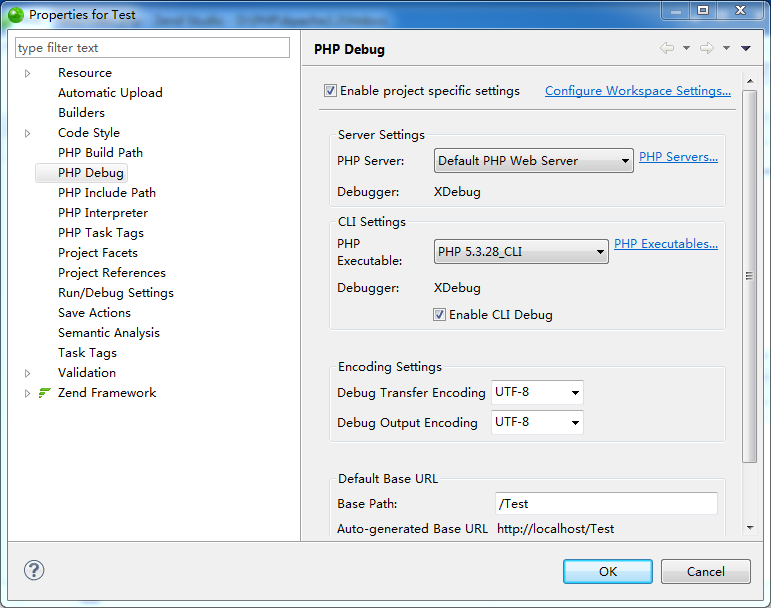
8)Debug Configurations设置如下:
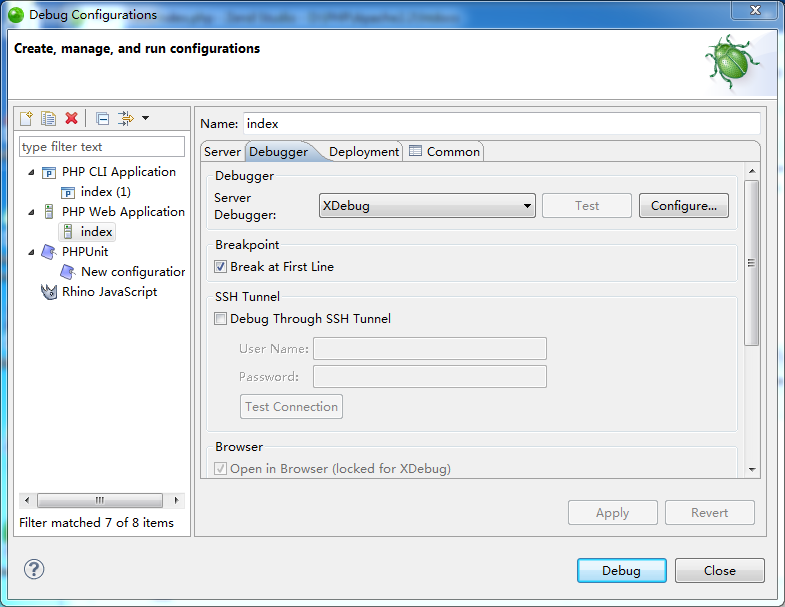
到此为止即可:Debug As PHP CLI Application和PHP Web Application进行断点调试了。
Win7 64bit
ZendStudio10.6.2(破解文件:http://download.csdn.net/download/xinzheng_wang/7643419)
Apache2.2.25(win32)
php-5.3.28 (线程安全,下载地址:http://windows.php.net/download/)
1)XDebug下载
XDebug可以到 http://xdebug.org/download.php 下载,可点击custom
installation instructions通过复制粘贴phpinfo()输出的内容得到需要下载的版本。
2)打开php.ini并在文件的最后增加如下配置,同时要重新启动Apache
[html] view
plaincopy
[XDebug]
;调试功能模块儿
;extension=php_xdebug-2.2.5-5.3-vc9.dll
zend_extension ="D:/PHP/php-5.3.28/ext/php_xdebug-2.2.5-5.3-vc9.dll"
xdebug.remote_handler=dbgp
;开启远程调试
xdebug.remote_enable = On
;远程主机
xdebug.remote_host=localhost
;主机端口
xdebug.remote_port=9000
;开启自动跟踪
xdebug.auto_trace = On
;开启异常跟踪
xdebug.show_exception_trace = On
;开启远程调试自动启动
xdebug.remote_autostart = On
;收集变量
xdebug.collect_vars = On
;收集返回值
xdebug.collect_return = On
;收集参数
xdebug.collect_params = On
;临时跟踪信息输出
;xdebug.trace_output_dir="d:/PHP/php-5.3.28/temp"
;显示局部变量
xdebug.show_local_vars = On
xdebug.profiler_enable = On
;xdebug.profiler_output_dir ="d:/PHP/php-5.3.28/temp"
xdebug.trace_enable_trigger =On
3)Window->Preferences->PHP Executable->Add如下:
4)设为Default如下:
5)Debug设置如下:
6)新Local PHP Project并增加断点如下:
7)右键点击工程,点击菜单Properties设置如下:
8)Debug Configurations设置如下:
到此为止即可:Debug As PHP CLI Application和PHP Web Application进行断点调试了。

相关文章推荐
- PHP开发环境——Zend Studio 12.5.1(64位)破解汉化
- php安装后,再添加模块pdo_mysql,mysqli
- WEIPHP使用
- PHP调用MYSQL存储过程实例
- yum安装报错有冲突file /usr/lib64/php/modules/fileinfo.so conflicts between
- Phpstorm 10更改主题和字体
- 自学php-PCRE兼容正则表达式
- 自学php-POSIX扩展正则表达式函数
- php5.6完全yum安装LAMP环境并加载fastcgi模块
- PHP操作Excel (创建Excel并写入数据)
- php学习心得---面向对象篇
- PHP中空字符串介绍0、null、empty和false之间的关系
- wget下载FTP的文件
- phpexecl导入时空行里面有空格导致导入空数据问题
- php的ci框架 配合phpmailer 发邮件
- 反转字符串
- Yii2-rbac
- PHP header用法
- PHP MySQLi_STMT 查找
- php 生成订单号