zabbix插件之grafana-zabbix实现炫酷图表
2015-08-05 10:38
330 查看
Grafana-zabbix是zabbix的一个插件,通过调用API接口呈现酷炫的图表
系统:Centos6.
1、安装grafana
[root@Monitor ~]# wget https://grafanarel.s3.amazonaws.com/builds/grafana-2.0.2-1.x86_64.rpm
[root@Monitor ~]# yum –y install grafana-2.0.2-1.x86_64.rpm
安装之后会有如下文件
二进制文件 /usr/sbin/grafana-server
启动脚本 /etc/init.d/grafana-server
环境变量 /etc/sysconfig/grafana-server
配置文件 /etc/grafana/grafana.ini
systemd服务 grafana-server.service
日志 /var/log/grafana/grafana.log
sqlite3数据库 /var/lib/grafana/grafana.db
2、启动grafana服务
[root@Monitor ~]# service grafana-serve rstart
Starting Grafana Server: .... nohup: redirecting stderr to stdout
OK
[root@Monitor ~]# chkconfig --add grafana-server
[root@Monitor ~]# chkconfig grafana-server on
[root@Monitor ~]# netstat -anpt | grepgrafana
tcp 0 0 :::3000 :::* LISTEN 15444/grafana-serve
tcp 0 0::ffff:172.16.112.110:3000 ::ffff:172.16.113.23:60566 ESTABLISHED 15444/grafana-serve
nohup: redirectingstderr to stdout(可能启动脚本的变量重定向有点错误,但不影响的服务的开启)
服务详情
启动用户 grafana
服务名称 grafana-server
默认端口 3000
账号 admin
密码 admin
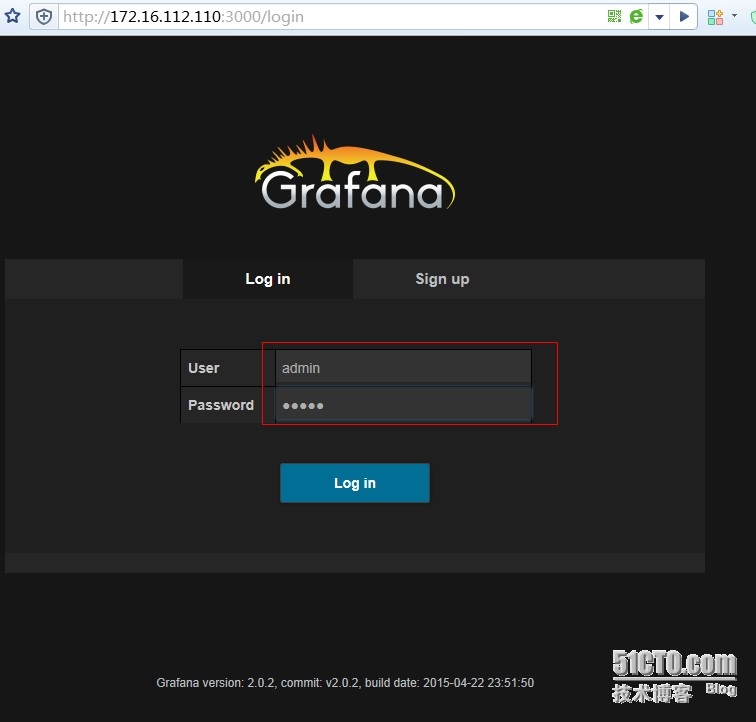
3、 登录管理界面(至此grafana安装成功)
4、安装grafana-zabbix插件
(也可通过下载源码包之后,解压https://github.com/alexanderzobnin/grafana-zabbix/releases/tag/v2.0.1。这里采用git clone命令)
https://github.com/alexanderzobnin/grafana-zabbix
[root@Monitor ~]# yum -y install git
[root@Monitor ~]# git clone https://github.com/alexanderzobnin/grafana-zabbix/ Initialized empty Git repository in/root/grafana-zabbix/.git/
remote: Counting objects: 955, done.
remote: Compressing objects: 100% (18/18),done.
remote: Total 955 (delta 10), reused 0(delta 0), pack-reused 937
Receiving objects: 100% (955/955), 176.96KiB | 159 KiB/s, done.
Resolving deltas: 100% (606/606), done.
[root@Monitor ~]# sudo cp -r grafana-zabbix/zabbix/ /usr/share/grafana/public/app/plugins/datasource/
[root@Monitor ~]# sudo vim /usr/share/grafana/public/app/plugins/datasource/zabbix/plugin.json
{
"pluginType": "datasource",
"name": "Zabbix",
"type": "zabbix",
"serviceName": "ZabbixAPIDatasource",
"module": "plugins/datasource/zabbix/datasource",
"partials": {
"config":"app/plugins/datasource/zabbix/partials/config.html",
"query":"app/plugins/datasource/zabbix/partials/query.editor.html",
"annotations":"app/plugins/datasource/zabbix/partials/annotations.editor.html"
},
"username": "zabbix", #配置用户名,注意此用户在zabbix中存在,且对zabbix数据有只读权限(不需要写权限)
"password": "zabbix", #配置密码
"trends": false,
"trendsFrom": "7d",
"limitmetrics": 100,
"metrics": true,
"annotations": true
}

5、重启服务
[root@Monitor ~]# service grafana-server restart
OKopping Grafana Server ... [ OK ]
Starting Grafana Server: .... nohup:redirecting stderr to stdout
OK
修改Zabbix的API文件,由于Zabbix2.2支持跨域问题,故添加以下配置#sudo vim /usr/share/zabbix/api_jsonrpc.phpheader('Access-Control-Allow-Origin: *');header('Access-Control-Allow-Headers: Content-Type');header('Access-Control-Allow-Methods: POST');header('Access-Control-Max-Age: 1000');if ($_SERVER['REQUEST_METHOD'] === 'OPTIONS') { return;}#添加(2.2已经有了,不用添加了)require_once dirname(__FILE__).'/include/func.inc.php';require_oncedirname(__FILE__).'/include/classes/core/CHttpRequest.php';
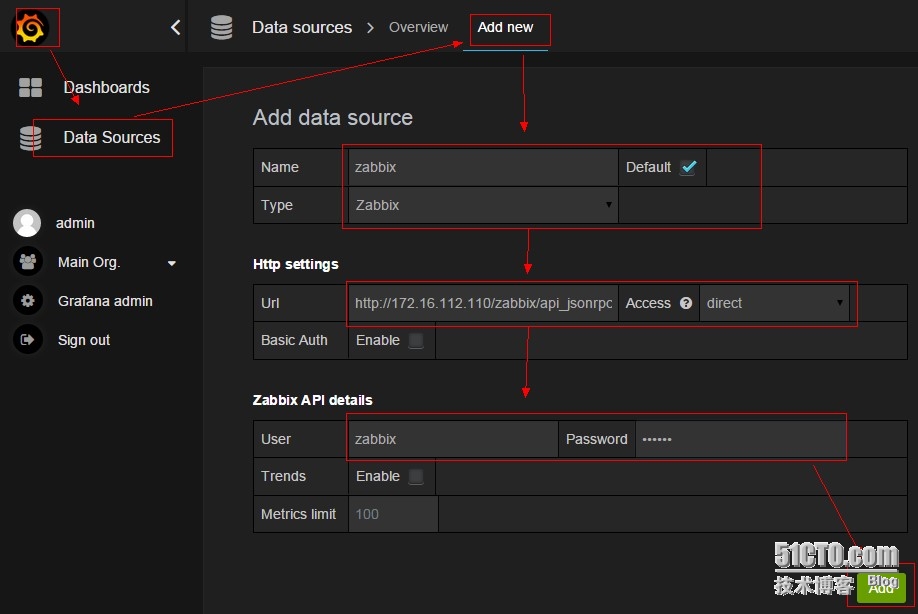
6、配置grafana
添加Datasource数据源
其中http settiong
Usrl:http://172.16.112.110/zabbix/api_jsonrpc.php
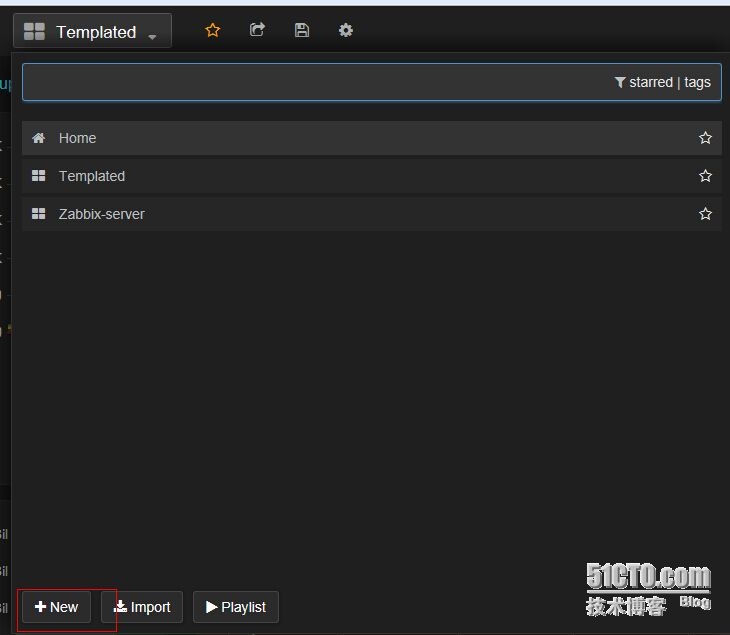
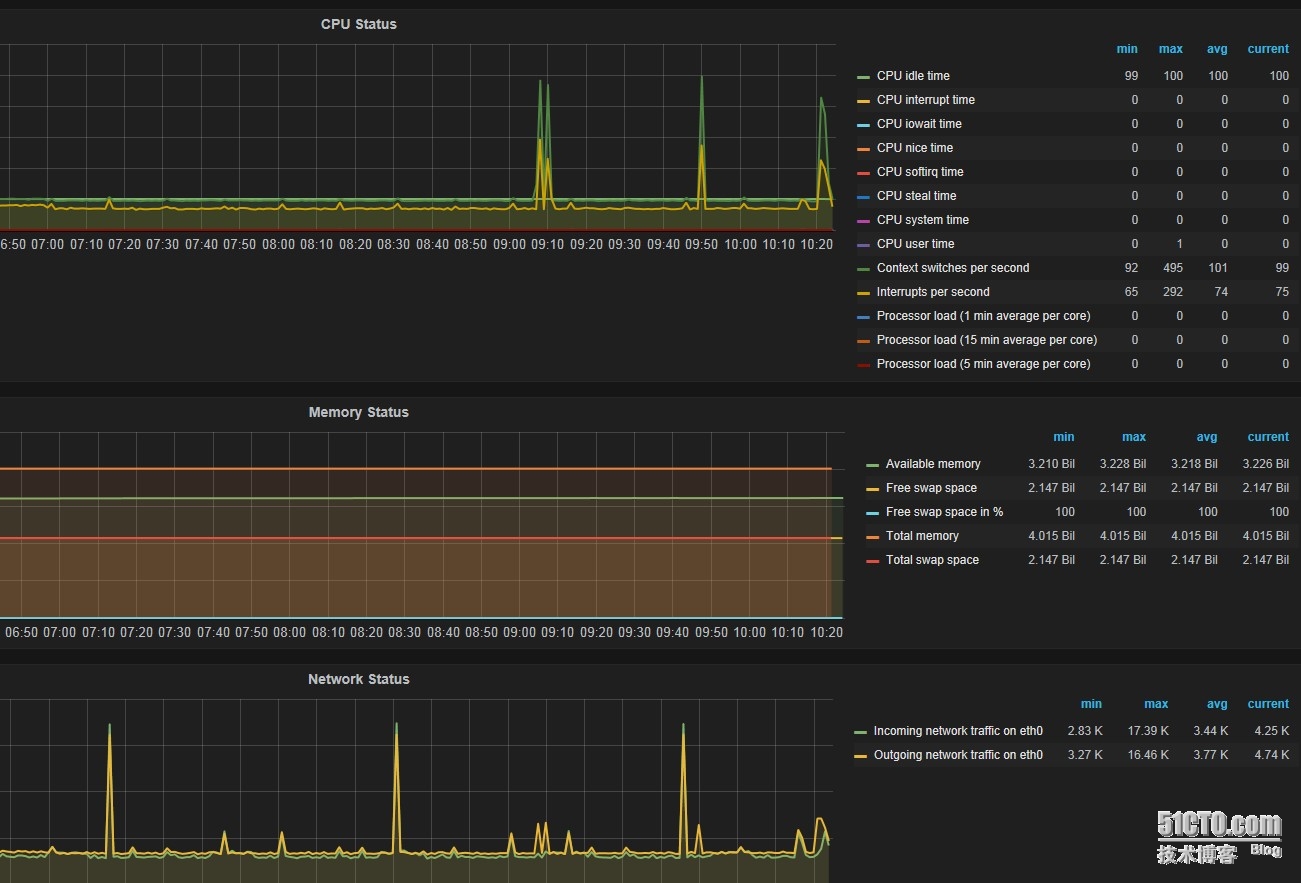
7、接下来就是添加grafana图形
参考https://github.com/alexanderzobnin/grafana-zabbix/wiki/Usage
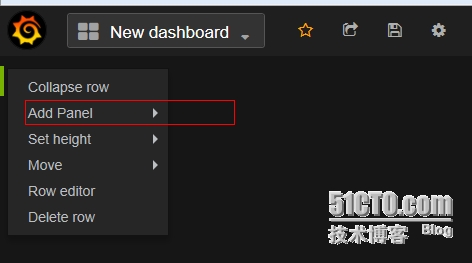
选择graph

系统:Centos6.
1、安装grafana
[root@Monitor ~]# wget https://grafanarel.s3.amazonaws.com/builds/grafana-2.0.2-1.x86_64.rpm
[root@Monitor ~]# yum –y install grafana-2.0.2-1.x86_64.rpm
安装之后会有如下文件
二进制文件 /usr/sbin/grafana-server
启动脚本 /etc/init.d/grafana-server
环境变量 /etc/sysconfig/grafana-server
配置文件 /etc/grafana/grafana.ini
systemd服务 grafana-server.service
日志 /var/log/grafana/grafana.log
sqlite3数据库 /var/lib/grafana/grafana.db
2、启动grafana服务
[root@Monitor ~]# service grafana-serve rstart
Starting Grafana Server: .... nohup: redirecting stderr to stdout
OK
[root@Monitor ~]# chkconfig --add grafana-server
[root@Monitor ~]# chkconfig grafana-server on
[root@Monitor ~]# netstat -anpt | grepgrafana
tcp 0 0 :::3000 :::* LISTEN 15444/grafana-serve
tcp 0 0::ffff:172.16.112.110:3000 ::ffff:172.16.113.23:60566 ESTABLISHED 15444/grafana-serve
nohup: redirectingstderr to stdout(可能启动脚本的变量重定向有点错误,但不影响的服务的开启)
服务详情
启动用户 grafana
服务名称 grafana-server
默认端口 3000
账号 admin
密码 admin
3、 登录管理界面(至此grafana安装成功)
4、安装grafana-zabbix插件
(也可通过下载源码包之后,解压https://github.com/alexanderzobnin/grafana-zabbix/releases/tag/v2.0.1。这里采用git clone命令)
https://github.com/alexanderzobnin/grafana-zabbix
[root@Monitor ~]# yum -y install git
[root@Monitor ~]# git clone https://github.com/alexanderzobnin/grafana-zabbix/ Initialized empty Git repository in/root/grafana-zabbix/.git/
remote: Counting objects: 955, done.
remote: Compressing objects: 100% (18/18),done.
remote: Total 955 (delta 10), reused 0(delta 0), pack-reused 937
Receiving objects: 100% (955/955), 176.96KiB | 159 KiB/s, done.
Resolving deltas: 100% (606/606), done.
[root@Monitor ~]# sudo cp -r grafana-zabbix/zabbix/ /usr/share/grafana/public/app/plugins/datasource/
[root@Monitor ~]# sudo vim /usr/share/grafana/public/app/plugins/datasource/zabbix/plugin.json
{
"pluginType": "datasource",
"name": "Zabbix",
"type": "zabbix",
"serviceName": "ZabbixAPIDatasource",
"module": "plugins/datasource/zabbix/datasource",
"partials": {
"config":"app/plugins/datasource/zabbix/partials/config.html",
"query":"app/plugins/datasource/zabbix/partials/query.editor.html",
"annotations":"app/plugins/datasource/zabbix/partials/annotations.editor.html"
},
"username": "zabbix", #配置用户名,注意此用户在zabbix中存在,且对zabbix数据有只读权限(不需要写权限)
"password": "zabbix", #配置密码
"trends": false,
"trendsFrom": "7d",
"limitmetrics": 100,
"metrics": true,
"annotations": true
}
5、重启服务
[root@Monitor ~]# service grafana-server restart
OKopping Grafana Server ... [ OK ]
Starting Grafana Server: .... nohup:redirecting stderr to stdout
OK
修改Zabbix的API文件,由于Zabbix2.2支持跨域问题,故添加以下配置#sudo vim /usr/share/zabbix/api_jsonrpc.phpheader('Access-Control-Allow-Origin: *');header('Access-Control-Allow-Headers: Content-Type');header('Access-Control-Allow-Methods: POST');header('Access-Control-Max-Age: 1000');if ($_SERVER['REQUEST_METHOD'] === 'OPTIONS') { return;}#添加(2.2已经有了,不用添加了)require_once dirname(__FILE__).'/include/func.inc.php';require_oncedirname(__FILE__).'/include/classes/core/CHttpRequest.php';
6、配置grafana
添加Datasource数据源
其中http settiong
Usrl:http://172.16.112.110/zabbix/api_jsonrpc.php
7、接下来就是添加grafana图形
参考https://github.com/alexanderzobnin/grafana-zabbix/wiki/Usage
选择graph

相关文章推荐
- java数组
- 【实例】使用jquery自带的slideToggle由上到下缓缓加载图片
- I2C总线
- 南邮 OJ 1190 约瑟夫问题
- php无限分类根据顶类获取所有子类
- 日经春秋 20150805
- error LNK2005, already defined?
- Unity的优化功能
- POJ 2752 Seek the Name,Seek the Fame
- 奇葩错误
- hibernate3-二级缓存配制 EHCache实战
- 逻辑与 按位与 逻辑或 按位或 逻辑非 按位非
- 阿里云盘亚马逊云盘的区别特性一览表
- Collections类方法详解
- 调用图灵机器人接口的问题
- 自定义导航按钮UIBarButtonItem
- 系统调用fcntl 和 ioctl
- 天声人語 20150805
- 10个学习Android开发的网站推荐
- 三分钟英语(二)—Alicha