1.linear Regression
2015-05-30 10:42
861 查看
参考斯坦福的UFLDL教程
http://ufldl.stanford.edu/tutorial/supervised/LinearRegression/Matlab函数说明
1.ones(M,N)产生M*N的全1矩阵。
ones(M)产生M*M的全1矩阵。
例子:
ones(2,3)
ans =

1     1     1
1     1     1
2.
randperm<N>产生1:N的随机序列
randperm(N,M)从1:N中随机选取M个数产生随机序列
例子:
randperm(5)

ans =

2     5     4     1     3

randperm(5,2)

ans =

3      4
3.
[a,I]=sort(a)对a进行排序,返回值a表示排序好的a,
I表示排序好后对应元素在原数组中位置。
例子:
temp=[2,5,3,1,7,4,3]

temp =
2     5     3     1     7     4     3

[temp,I]=sort(temp)

temp =
1     2     3     3     4     5     7

I =
4     1     3     7     6     2     5
重要公式
1.J(θ)的计算公式
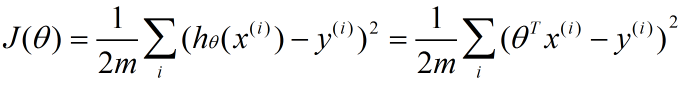
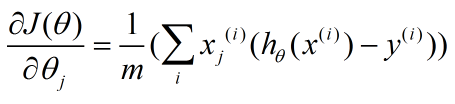
2.
梯度g的计算公式
代码
linreg.m文件%载入房屋数据
%该房屋数据:506*14
%前面13列是特征,最后一列是要预测的房价
data=load('housing.data');
%为该房屋数据加上1列,全为1,代表x0
data=data';%将data取转置,这样好将全1列加上去
data=[ones(1,size(data,2));data];%将全1的x0加上去,此时数据变为15*506
%shuffle the data(洗牌,对列进行洗牌)
data=data(:,randperm(size(data,2)));
%分成训练集合测试集
%end表示最后最后一行(列)
train.X=data(1:end-1,1:400);%训练集特征(1:14列,1:400行)
train.y=data(end,1:400);%训练集标签(最后1列,1:400行)
test.X=data(1:end-1,401:end);%测试集特征(1:14列,401:最后1行)
test.y=data(end,401:end);%测试集标签(最后1列,401:最后1行)
%m=14.
m=size(train.X,1);
%随机初始化权值向量theta
%n*1的值为0-1间的向量
%这里即为14*1 的值为0-1间的向量
theta=rand(m,1);
%tic和toc用于计时
tic;
%fminunc用来求局部最小值,求的是linear_regression第一个返回值的最小值时theta的值
%fminunc会调用高级梯度下降算法求解最小值
%GradObj on 表示目标函数linear)regreesion的返回值需要提供第二个参数:梯度
%GradObj off 表示自动调用系统默认的梯度计算公式
%MaxIter 表示最大迭代次数
options = optimset('MaxIter',200,'GradObj','on');
%得到使目标函数最小时的theta
%train.X,train.y为目标函数另外两个参数
%fminunc(FUN,X0,OPTIONS),从X0开始,不断调整X0,最终得到使目标函数最小的X即theta,
%在options后面再加上目标函数剩下的参数,位置不能错
%functionVal表示最后求得的最小值,exitFlag=1表示收敛,由于设置了MaxTter,一般还没到收敛就会停止
[theta,functionVal,exitFlag]=fminunc(@linear_regression,theta,options,train.X,train.y)
% %f表示小数
fprintf('优化用了%f秒\n', toc);
% 对训练集预测
actual_prices = train.y;
predicted_prices = theta'*train.X;%theta:14*1 train.X:14*400
% 训练集的rms
train_rms=sqrt(mean((predicted_prices - actual_prices).^2));
% %f表示小数
fprintf('RMS training error: %f\n', train_rms);
% 测试集的rms
actual_prices = test.y;
predicted_prices = theta'*test.X;
test_rms=sqrt(mean((predicted_prices - actual_prices).^2));
fprintf('RMS testing error: %f\n', test_rms);
% Plot predictions on test data.
plot_prices=true;
if (plot_prices)
%排序
[actual_prices,I] = sort(actual_prices);
predicted_prices=predicted_prices(I);
plot(actual_prices, 'rx');
hold on;
plot(predicted_prices,'bx');
legend('Actual Price', 'Predicted Price');
xlabel('House #');
ylabel('House price ($1000s)');
endlinear_regression.m文件
%第一个参数是要不
4000
断调整的theta,后面两个是固定参数X,y,theta一定要放在最前面
function [f,g] = linear_regression(theta,X,y)
%X=14*400,特征数*样本数
%y=14*1
m=size(X,2);%m=400,表示400个样本

%J(theta) 见J(theta)公式
f=1/(2*m)*sum((theta'*X-y).^2);
% 梯度 14*1 见梯度公式
g=(1/m)*X*(theta'*X-y)';

相关文章推荐
- 图像识别和图像搜索
- 卷积神经网络
- 深度学习札记
- 图像智能打标签‘神器’-AlchemyVision API
- ubuntu theano 安装成功,windows theano安装失败
- Deep learning: autoencoders and sparsity
- 开设博客初衷
- 从CVPR2013看计算机视觉研究的三个趋势
- DL相关文献整理
- ImageNet Classification with Deep Convolutional Neural Networks 阅读理解及问题
- Exercise:Convolution and Pooling 代码示例
- Exercise:Learning color features with Sparse Autoencoders 代码示例
- Exercise: Implement deep networks for digit classification 代码示例
- Exercise:Softmax Regression 代码示例
- Exercise:PCA and Whitening 代码示例
- Exercise:PCA in 2D 代码示例
- Exercise:Vectorization 代码示例
- Exercise:Sparse Autoencoder 代码示例
- Large Scale Distributed Deep Networks 阅读笔记
- deep learning in NLP—深度学习在自然语言处理中的应用—入门学习序列