用 python matplotlib 画图 简单记录
2012-08-11 10:49
736 查看
我们团队准备改造现有的监控机制
由于性能原因
考虑将业务数据趋势图
由VBA生成改造成用python的matplotlib
顺便记录下一个cookbook http://www.scipy.org/Cookbook -------
还有 http://www.lfd.uci.edu/~gohlke/pythonlibs/
===========================================
依次安装
python 2.7
numpy-MKL-1.6.2.win32-py2.7
matplotlib-1.1.0.win32-py2.7
basemap-1.0.4.win32-py2.7(测试下)
----------------------
(办公室网连接sourceforge 好像不行了)
本人山寨代码如下
from mpl_toolkits.basemap import Basemap
import matplotlib.pyplot as plt
import numpy as np
# set up orthographic map projection with
# perspective of satellite looking down at 50N, 100W.
# use low resolution coastlines.
# don't plot features that are smaller than 1000 square km.
map = Basemap(projection='ortho', lat_0 = 30, lon_0 = 100,
resolution = 'l', area_thresh = 1000.)
# draw coastlines, country boundaries, fill continents.
map.drawcoastlines()
map.drawcountries()
map.fillcontinents(color = 'coral')
# draw the edge of the map projection region (the projection limb)
map.drawmapboundary()
# draw lat/lon grid lines every 30 degrees.
map.drawmeridians(np.arange(0, 360, 30))
map.drawparallels(np.arange(-90, 90, 30))
#lat/lon coordinates of five cities.
lats = [39.9, 22.5]
lons = [116.4, 114]
cities=['BeiJing','ShenZhen']
# compute the native map projection coordinates for cities.
x,y = map(lons,lats)
# plot filled circles at the locations of the cities.
map.plot(x,y,'bo')
# plot the names of those five cities.
for name,xpt,ypt in zip(cities,x,y):
plt.text(xpt+50000,ypt+50000,name)
plt.show()
-------------
原代码参见http://www.scipy.org/Cookbook/Matplotlib/Maps
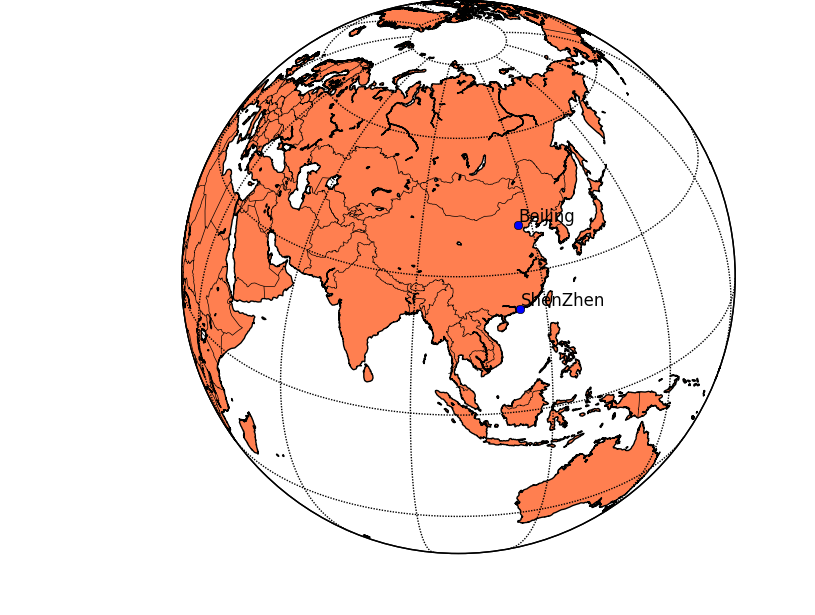
效果如下
由于性能原因
考虑将业务数据趋势图
由VBA生成改造成用python的matplotlib
顺便记录下一个cookbook http://www.scipy.org/Cookbook -------
还有 http://www.lfd.uci.edu/~gohlke/pythonlibs/
===========================================
依次安装
python 2.7
numpy-MKL-1.6.2.win32-py2.7
matplotlib-1.1.0.win32-py2.7
basemap-1.0.4.win32-py2.7(测试下)
----------------------
(办公室网连接sourceforge 好像不行了)
本人山寨代码如下
from mpl_toolkits.basemap import Basemap
import matplotlib.pyplot as plt
import numpy as np
# set up orthographic map projection with
# perspective of satellite looking down at 50N, 100W.
# use low resolution coastlines.
# don't plot features that are smaller than 1000 square km.
map = Basemap(projection='ortho', lat_0 = 30, lon_0 = 100,
resolution = 'l', area_thresh = 1000.)
# draw coastlines, country boundaries, fill continents.
map.drawcoastlines()
map.drawcountries()
map.fillcontinents(color = 'coral')
# draw the edge of the map projection region (the projection limb)
map.drawmapboundary()
# draw lat/lon grid lines every 30 degrees.
map.drawmeridians(np.arange(0, 360, 30))
map.drawparallels(np.arange(-90, 90, 30))
#lat/lon coordinates of five cities.
lats = [39.9, 22.5]
lons = [116.4, 114]
cities=['BeiJing','ShenZhen']
# compute the native map projection coordinates for cities.
x,y = map(lons,lats)
# plot filled circles at the locations of the cities.
map.plot(x,y,'bo')
# plot the names of those five cities.
for name,xpt,ypt in zip(cities,x,y):
plt.text(xpt+50000,ypt+50000,name)
plt.show()
-------------
原代码参见http://www.scipy.org/Cookbook/Matplotlib/Maps
效果如下

相关文章推荐
- python matplotlib 画图保存图片简单例子
- 【python系列】matplotlib简单画图subplot
- Python实战小程序利用matplotlib模块画图代码分享
- Python 使用matplotlib画图添加标注、及移动坐标轴位置
- Python之Matplotlib画图方法
- python 安装画图工具matplotlib
- Python画图工具matplotlib的使用(图形并茂)
- Python-Matplotlib安装及简单使用
- python Matplotlib画图之调整字体大小的示例
- 【Python】Matplotlib画图(二)——根据函数公式画图
- python matplotlib 画图知识点列表
- python matplotlib简单示例
- Python画图工具matplotlib的安装
- python画图——matplotlib.plot 学习
- win10 64位 Python 安装matplotlib 过程记录
- python3.X安装matplotlib简单方法
- Python:matplotlib画图----如何控制画图范围,如何画两条曲线间的阴影,如何控制Y轴现实范围
- Python之Matplotlib画图方法
- python 中matplotlib 画图导入到word中如何保证分辨率
- 【利用python进行数据分析-学习记录】python-matplotlib中Basemap插件的安装