asp.net core监控—引入Prometheus(五)
2021-01-02 16:56
1306 查看
上一篇博文中说到Prometheus有四种指标类型:Counter(计数器)、Gauge(仪表盘)、Histogram(直方图)、Summary(摘要),并且我们做了一个Counter的Demo,接下来看看Histogram。
Summary:摘要
summary是采集展示百分位数,百分位定义:在一组由小到大的数字中,某个数字大于90%的数字,这个数字就是第90个的百分位数。
通过demo的来理解一下吧,假如我们业务需求是要知道订单金额10,30,50,70,90的百分位数,该怎么实现呢?
需要在MetricsHub.cs中添加Summary类型的指标收集集合:
using Prometheus;
using System.Collections.Generic;
namespace PrometheusSample.Middlewares
{
public class MetricsHub
{
private static Dictionary<string, Counter> _counterDictionary = new Dictionary<string, Counter>();
private static Dictionary<string, Dictionary<string, Gauge>> _gaugeDictionary = new Dictionary<string, Dictionary<string, Gauge>>();
private static Dictionary<string, Summary> _summaryDictionary = new Dictionary<string, Summary>();
private static Dictionary<string, Histogram> _histogramDictionary = new Dictionary<string, Histogram>();
public Counter GetCounter(string key)
{
if (_counterDictionary.ContainsKey(key))
{
return _counterDictionary[key];
}
else
{
return null;
}
}
public Dictionary<string, Gauge> GetGauge(string key)
{
if (_gaugeDictionary.ContainsKey(key))
{
return _gaugeDictionary[key];
}
else
{
return null;
}
}
public Summary GetSummary(string key)
{
if (_summaryDictionary.ContainsKey(key))
{
return _summaryDictionary[key];
}
else { return null; }
}
public Histogram GetHistogram(string key)
{
if (_histogramDictionary.ContainsKey(key))
{
return _histogramDictionary[key];
}
else { return null; }
}
public void AddCounter(string key, Counter counter) { _counterDictionary.Add(key, counter); }
public void AddGauge(string key, Dictionary<string, Gauge> gauges) { _gaugeDictionary.Add(key, gauges); }
public void AddSummary(string key, Summary summary) { _summaryDictionary.Add(key, summary); }
public void AddHistogram(string key, Histogram histogram) { _histogramDictionary.Add(key, histogram); }
}
}
接下来就要在BusinessMetricsMiddleware的中间件中添加处理Summary指标的代码了:
using Microsoft.AspNetCore.Http;
using PrometheusSample.Models;
using System.IO;
using System.Threading.Tasks;
namespace PrometheusSample.Middlewares
{
/// <summary>
/// 请求记录中间件
/// </summary>
public class BusinessMetricsMiddleware
{
private readonly RequestDelegate _next; public BusinessMetricsMiddleware(RequestDelegate next) { _next = next; }
public async Task InvokeAsync(HttpContext context, MetricsHub metricsHub)
{
var originalBody = context.Response.Body; try
{
using (var memStream = new MemoryStream())
{
//从管理返回的Response中取出返回数据,根据返回值进行监控指标计数
context.Response.Body = memStream;
await _next(context);
memStream.Position = 0;
string responseBody = new StreamReader(memStream).ReadToEnd();
memStream.Position = 0;
await memStream.CopyToAsync(originalBody);
if (metricsHub.GetCounter(context.Request.Path) != null || metricsHub.GetGauge(context.Request.Path) != null)
{
//这里约定所有action返回值是一个APIResult类型
var result = System.Text.Json.JsonSerializer.Deserialize<APIResult>(responseBody, new System.Text.Json.JsonSerializerOptions { PropertyNameCaseInsensitive = true });
if (result != null && result.Result)
{
//获取到Counter
var counter = metricsHub.GetCounter(context.Request.Path);
if (counter != null)
{
//计数
counter.Inc();
}
var gauges = metricsHub.GetGauge(context.Request.Path); if (gauges != null)
{
//存在增加指标+就Inc
if (gauges.ContainsKey("+")) { gauges["+"].Inc(); }
//存在减少指标-就Dec
if (gauges.ContainsKey("-")) { gauges["-"].Dec(); }
}
var histogram = metricsHub.GetHistogram(context.Request.Path); if (histogram != null)
{
var parseResult = int.TryParse(result.Data.ToString(), out int i);
if (parseResult)
{
histogram.Observe(i);
}
}
var summary = metricsHub.GetSummary(context.Request.Path);
if (summary != null)
{
var parseResult = int.TryParse(result.Data.ToString(), out int i);
if (parseResult)
{
summary.Observe(i);
}
}
}
}
}
}
finally
{
context.Response.Body = originalBody;
}
}
}
}
再就是在Starsup中配置对应url的Summary参数了:
using Microsoft.AspNetCore.Builder;
using Microsoft.AspNetCore.Hosting;
using Microsoft.Extensions.Configuration;
using Microsoft.Extensions.DependencyInjection;
using Microsoft.Extensions.Hosting;
using Microsoft.OpenApi.Models;
using Prometheus;
using PrometheusSample.Middlewares;
using PrometheusSample.Services;
using System.Collections.Generic;
namespace PrometheusSample
{
public class Startup
{
public Startup(IConfiguration configuration) { Configuration = configuration; }
public IConfiguration Configuration { get; }
public void ConfigureServices(IServiceCollection services)
{
MetricsHandle(services);
services.AddScoped<IOrderService, OrderService>();
services.AddControllers(); services.AddSwaggerGen(c =>
{
c.SwaggerDoc("v1", new OpenApiInfo { Title = "PrometheusSample", Version = "v1" });
});
}
public void Configure(IApplicationBuilder app, IWebHostEnvironment env)
{
if (env.IsDevelopment())
{
app.UseDeveloperExceptionPage();
app.UseSwagger();
app.UseSwaggerUI(c => c.SwaggerEndpoint("/swagger/v1/swagger.json", "PrometheusSample v1"));
}
app.UseRouting();
//http请求的中间件
app.UseHttpMetrics();
app.UseAuthorization();
//自定义业务跟踪
app.UseBusinessMetrics();
app.UseEndpoints(endpoints =>
{
//映射监控地址为  /metrics
endpoints.MapMetrics();
endpoints.MapControllers();
});
}
/// <summary>
/// 处理监控事项
/// </summary>
/// <param name="services"></param>
void MetricsHandle(IServiceCollection services)
{
var metricsHub = new MetricsHub();
//counter
metricsHub.AddCounter("/register", Metrics.CreateCounter("business_register_user", "注册用户数。"));
metricsHub.AddCounter("/order", Metrics.CreateCounter("business_order_total", "下单总数。"));
metricsHub.AddCounter("/pay", Metrics.CreateCounter("business_pay_total", "支付总数。"));
metricsHub.AddCounter("/ship", Metrics.CreateCounter("business_ship_total", "发货总数。"));
//gauge
var orderGauge = Metrics.CreateGauge("business_order_count", "当前下单数量。");
var payGauge = Metrics.CreateGauge("business_pay_count", "当前支付数量。");
var shipGauge = Metrics.CreateGauge("business_ship_count", "当前发货数据。");
metricsHub.AddGauge("/order", new Dictionary<string, Gauge>
{
{ "+", orderGauge }
});
metricsHub.AddGauge("/pay", new Dictionary<string, Gauge>
{
{ "-", orderGauge },
{ "+", payGauge }
});
metricsHub.AddGauge("/ship", new Dictionary<string, Gauge> {
{ "+", shipGauge },
{ "-", payGauge }
});
//histogram
var orderHistogram = Metrics.CreateHistogram("business_order_histogram", "订单直方图。", new HistogramConfiguration
{
Buckets = Histogram.LinearBuckets(start: 1000, width: 1000, count: 6)
});
metricsHub.AddHistogram("/order", orderHistogram);
//summary
var orderSummary = Metrics.CreateSummary("business_order_summary", "10分钟内的订单数量", new SummaryConfiguration
{
Objectives = new[]
{
new QuantileEpsilonPair(0.1, 0.05),
new QuantileEpsilonPair(0.3, 0.05),
new QuantileEpsilonPair(0.5, 0.05),
new QuantileEpsilonPair(0.7, 0.05),
new QuantileEpsilonPair(0.9, 0.05),
}
});
metricsHub.AddSummary("/order", orderSummary);
services.AddSingleton(metricsHub);
}
}
}
其实 new QuantileEpsilonPair(0.1, 0.05) 第一个参数是百分位,0.05是误差,范围是10%-5%,10%+5%。
最后一步,就是打开Grafana来配置展示图表了。
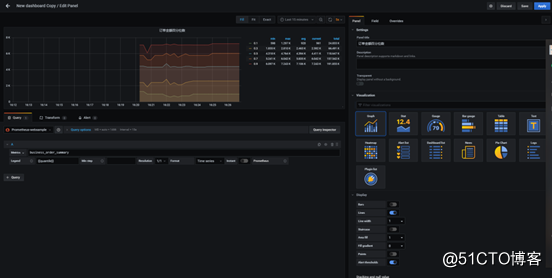
最终展示结果:
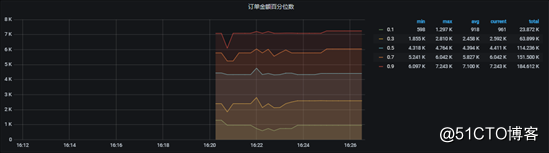
同时事例中给出了最大、最少、平均、汇总、当前值以供参考。

相关文章推荐
- asp.net core监控—引入Prometheus(六)
- ASP.NET Core之跨平台的实时性能监控(2.健康检查)
- ASP.NET Core之跨平台的实时性能监控
- ASP.NET Core之跨平台的实时性能监控(2.健康检查)
- ASP.NET Core之跨平台的实时性能监控
- ASP.NET Core之跨平台的实时性能监控(2.健康检查)
- ASP.NET Core之跨平台的实时性能监控
- ASP.NET Core之跨平台的实时性能监控(2.健康检查)
- 图析ASP.NET Core引入gRPC服务模板
- 微服务监控zipkin+asp.net core
- 微服务监控zipkin+asp.net core
- ASP.NET Core之跨平台的实时性能监控(2.健康检查)
- 使用NLog给Asp.Net Core做请求监控的方法
- 菜鸟入门【ASP.NET Core】9:RoutingMiddleware介绍以及MVC引入
- ASP.NET Core 特性 根命名空间 不同场景引入的特性
- ASP.NET Core之跨平台的实时性能监控(2.健康检查)
- ASP.NET Core 简单引入教程
- ASP.NET Core之跨平台的实时性能监控
- 【ASP.NET Core快速入门】(九) RoutingMiddleware介绍以及MVC引入
- ASP.NET Core 2.0 新功能汇总