Promethus集群部署笔记:(二)安装并配置prometheus
2020-11-23 14:02
615 查看
官方参考文档:https://prometheus.io/docs/prometheus/latest/getting_started/
1、防火墙配置
firewall-cmd --zone=public --add-port=9090/tcp --permanent

firewall-cmd --reload
2、下载prometheus
mkdir /ssd/prometheus/

mkdir /sas/prometheus/prometheus/
cd /sas/prometheus/prometheus/

wget https://github.com/prometheus/prometheus/releases/download/v2.22.2/prometheus-2.22.2.linux-amd64.tar.gz

tar xvfz prometheus-*.tar.gz
cd prometheus-*
3、修改prometheus,监控自身
vi /sas/prometheus/prometheus/prometheus.yml

# my global config
global:
scrape_interval:     15s # Set the scrape interval to every 15 seconds. Default is every 1 minute.
evaluation_interval: 15s # Evaluate rules every 15 seconds. The default is every 1 minute.
# scrape_timeout is set to the global default (10s).

# Attach these labels to any time series or alerts when communicating with
# external systems (federation, remote storage, Alertmanager).
external_labels:
monitor: 'devops-monitor01'

# Alertmanager configuration
alerting:
alertmanagers:
- static_configs:
- targets:
# - alertmanager:9093

# Load rules once and periodically evaluate them according to the global 'evaluation_interval'.
rule_files:
# - "first_rules.yml"
# - "second_rules.yml"

# A scrape configuration containing exactly one endpoint to scrape:
# Here it's Prometheus itself.
scrape_configs:
# The job name is added as a label `job=<job_name>` to any timeseries scraped from this config.
- job_name: 'prometheus'

# metrics_path defaults to '/metrics'
# scheme defaults to 'http'.

# Override the global default and scrape targets from this job every 5 seconds.
scrape_interval: 5s

static_configs:
- targets: ['10.255.200.1:9090','10.255.200.2:9090','10.255.200.3:9090']
4、编写Systemd服务管理配置文件
vi /usr/lib/systemd/system/prometheus.service

[Unit]
Description=Prometheus Services
After=network.target remote-fs.target

[Service]
Type=simple
ExecStart=/sas/prometheus/prometheus/prometheus --config.file=/sas/prometheus/prometheus/prometheus.yml --storage.tsdb.path=/ssd/prometheus/
Restart=on-failure
RestartSec=5

[Install]
WantedBy=multi-user.target
5、启动prometheus服务
systemctl daemon-reload

systemctl start prometheus
systemctl status prometheus
systemctl enable prometheus
6、查看监控数据
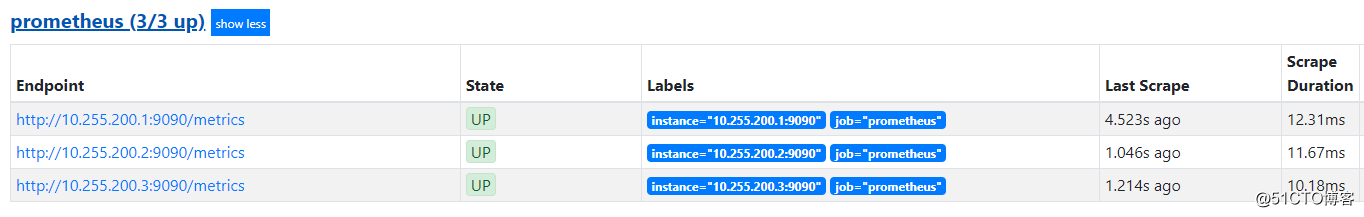
浏览器访问:http://10.255.200.1:9090/targets 。可看到3个节点都正常上线,状态为:UP。
浏览器访问:http://10.255.200.1:9090/metrics 。可看到相应的监控数据。


相关文章推荐
- Promethus集群部署笔记:(一)安装并配置Grafana高可用集群
- HBase入门笔记(四)--完全分布式HBase集群安装配置
- HBase入门笔记(三)-- 完全分布模式Hadoop集群安装配置
- HBase入门笔记(三)-- 完全分布模式Hadoop集群安装配置
- 第116讲:Hadoop集群之安装Java、创建Hadoop用户、配置SSH等实战学习笔记
- Hadoop学习笔记之HA集群安装部署
- Twitter Storm安装配置(集群)笔记
- Hadoop集群(第5期)_Hadoop安装配置 1、集群部署介绍 1.1 Hadoop简介 Hadoop是Apache软件基金会旗下的一个开源分布式计算平
- CentOS6.5下redis安装部署配置指南、常用命令、主从同步集群、redis-php学习资料整合详解
- hadoop学习笔记之hadoop集群安装配置
- Zookeeper学习笔记—Zookeeper的安装和配置(集群模式)
- Apache+Tomcat集群和负载均衡安装配置笔记
- CloudStack + XenServer 部署 – XenServer集群的安装和配置(4).
- Hadoop-2.5.1集群安装配置笔记
- Redis基本知识、安装、部署、配置笔记
- Hadoop学习笔记(十一)---hadoop集群安装及配置
- 王高利:CentOS6.5下redis安装部署配置指南、常用命令、主从同步集群、redis-php学习资料整合详解
- ElasticSearch 5.1.1 安装开发部署总结 集群配置
- Kafka详细教程:下载、安装、配置与集群部署
- centos7下最新版(7.3.2)ELK+FileBeat+Kafka集群安装部署配置