小程序中使用echarts
2020-07-14 05:56
501 查看
小程序中使用echarts需要下载专用插件ec-canvas
链接:https://pan.baidu.com/s/1Kg1x_5iUFIJtvx7l1Zpd4g
提取码:rgjg
下载后引到项目中
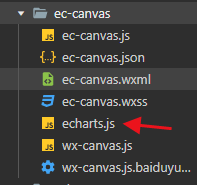
这个是echarts官方js,建议根据自己需求定制下载功能下载链接,下载后替换即可,示例中的js为仪表盘功能
在wxml中添加如下代码
<view class="echart_panel" style="height:260rpx;">
<ec-canvas canvasId="mychart-bar" ec="{{ecLine}}" id="mychart-dom-bar" style="height:260rpx;"></ec-canvas>
</view>
要是用的js中引用js
var echarts = require("../../ec-canvas/echarts.js")
在js中创建对象
Page({
data: {
ecLine: {},
},
onload(){
this.get();
},
get() {
var ecLine = {
onInit(canvas, width) {
//初始化echarts元素,绑定到全局变量,方便更改数据
var chartLine = echarts.init(canvas, null, {
width: width,
height: 150
});
canvas.setChart(chartLine);
var score =a.getscore();
var scores = score / 10000;
根据个人需求创建option对象,具体配置看官方文档、示例
var option = {
backgroundColor: '#fff',
tooltip: {
formatter: '{a} <br/>{b} : {c}%'
},
toolbox: {
feature: {
restore: {},
saveAsImage: {}
}
},
series: [{
name: '积分',
type: 'gauge',
min: 0,
max: 10000,
radius: '100%',
center: ['50%', '70%'],
startAngle: 180,
endAngle: 0,
axisLine: { // 坐标轴线
lineStyle: { // 属性lineStyle控制线条样式
color: [
[scores, 'red'],
[1, '#888']
],
width: 5,
}
},
axisLabel: { // 坐标轴小标记
distance: -40,
color: '#333',
formatter: function (v) {
switch (v + '') {
case '0':
return '0';
case '1000':
return '1千';
case '2000':
return '2千';
case '3000':
return '3千';
case '4000':
return '4千';
case '5000':
return '5千';
case '6000':
return '6千';
case '7000':
return '7千';
case '8000':
return '8千';
case '9000':
return '9千';
case '10000':
return '1万';
}
}

},
splitLine: { // 分隔线
length: 10, // 属性length控制线长
lineStyle: { // 属性lineStyle(详见lineStyle)控制线条样式
width: 1,
color: '#888'
},

},
pointer: {
show: false,
},
title: {
textStyle: { // 其余属性默认使用全局文本样式,详见TEXTSTYLE
fontSize: '16',
color: '#f10',
},
offsetCenter: [0, -5]

},
detail: { // x, y,单位px
textStyle: { // 其余属性默认使用全局文本样式,详见TEXTSTYLE
fontWeight: 'bolder',
color: '#333',
fontSize: '18',
},
offsetCenter: [0, -30]
},
data: [{ //需要二次渲染的将data中的值放到app.js中,否知取不到值
value: score,
name: '累计积分'
}]
}]
};
//循环获取数据信息
setInterval(() => {
var score =a.getscore();
var scores = score / 10000;
console.log(option.series[0].data[0].value);
option.series[0].data[0].value=score;
option.series[0].axisLine.lineStyle.color[0][0]=scores
//true是为了可以二次绘画
chartLine.setOption(option,true);
}, 3000);
chartLine.setOption(option,true);
return chartLine;
}
}
this.setData({
ecLine
})
},
})

相关文章推荐
- 微信小程序--使用ECharts
- 微信小程序中使用ECharts 异步加载数据实现图表功能
- 微信小程序中使用echarts的实现方法
- 微信小程序使用echarts模糊
- 微信小程序使用 ECharts的方法
- 微信小程序使用Echarts
- 微信小程序使用echarts随笔
- 微信小程序中--使用ECharts实现多个图表展示
- 微信小程序使用 ECharts 实现数据可视化
- 小程序使用echarts
- 微信小程序使用echarts异步请求数据
- wepy 小程序 echarts 搭配使用
- 在微信小程序中使用 ECharts
- ECharts 全新大版本 4.0 正式发布 即将支持微信小程序中使用ECharts
- 微信小程序中使用ECharts 异步加载数据的方法
- 微信小程序使用echarts获取数据并生成折线图
- 微信小程序使用echarts动态请求数据更新
- 在微信小程序中如何使用ECharts 避免踩坑
- 微信小程序Echarts图表组件使用方法详解
- 在 mpvue 使用 h5二八杠源码出售echarts 小程序组件