淘宝电商用户行为数据分析及可视化—基于MySQL/Power BI(含代码)
本项目以阿里巴巴移动电商平台的真实用户-商品行为数据为基础,使用MySQL进行数据清洗,以AARRR模型、RFM模型为基础展开分析,再用Power BI做可视化,最后从提升用户活跃度、促进商品成交、差异化用户营销三个方面提出建议。
参考了网上公开分享的一些帖子,把思路整合后发现:需要提取的一些模型、指标、算法,基本可以落到AARRR模型、RFM模型中。因此从这两个模型出发,查找需要的数据,进行分析,再把部分数据使用Power BI可视化。
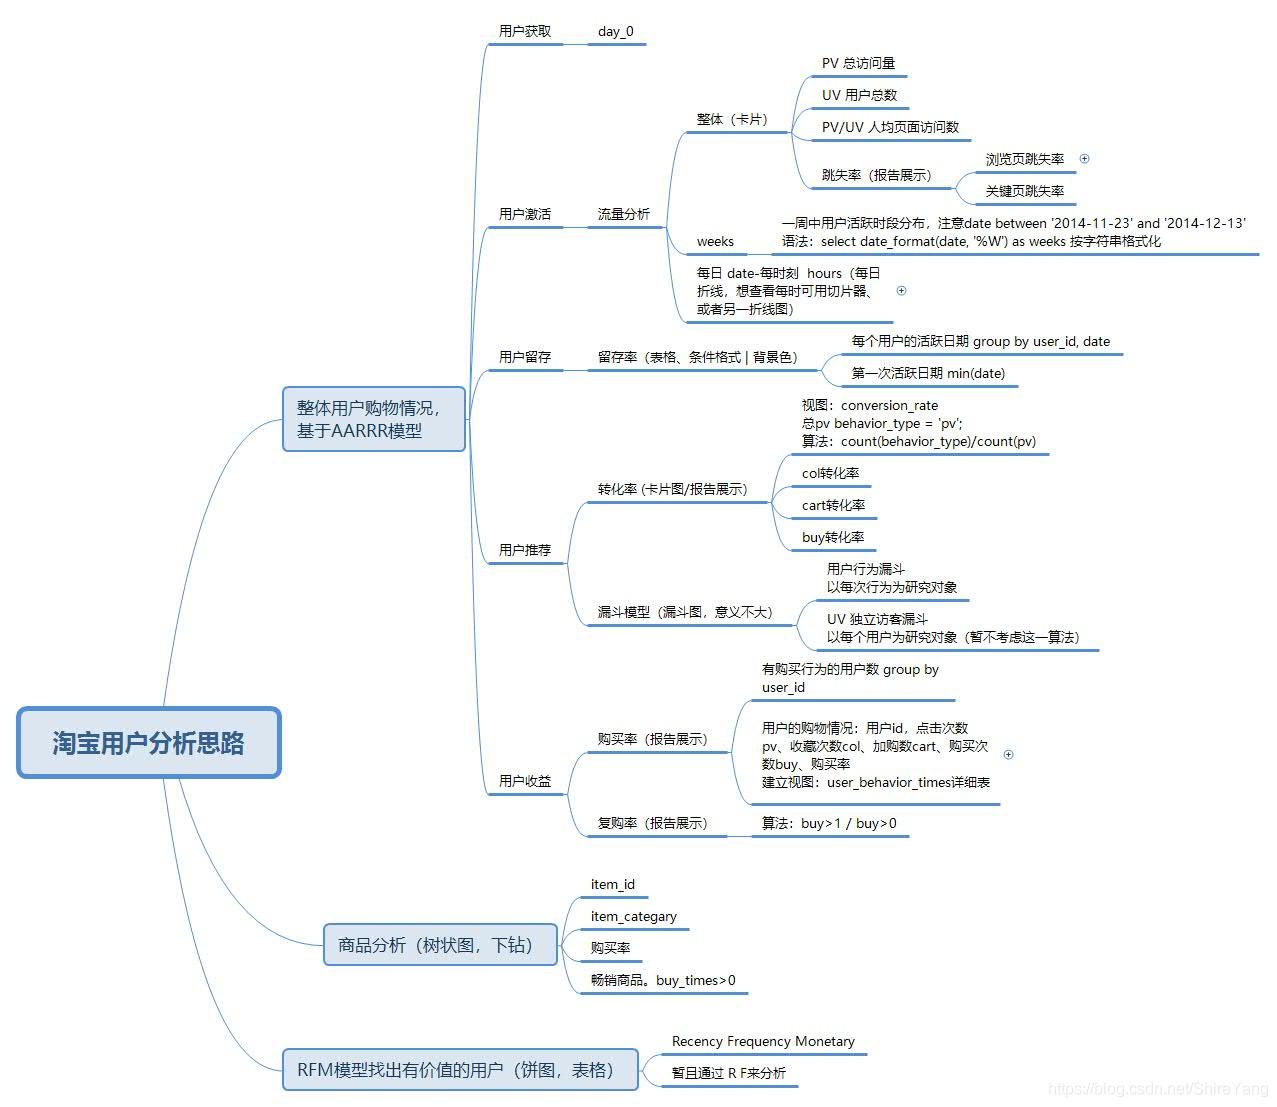
在正式写代码之前,先理顺分析思路,同时考虑后续可视化过程会用到的数据、表现形式。当然,所有的细节部分不是一下就能全部想好的,也是在敲代码的过程中不断完善。
我的思维导图▼
Let’s Go. 让我们一起开始吧。
一、数据源
数据来自天池竞赛:
https://tianchi.aliyun.com/dataset/dataDetail?dataId=46&userId=1
竞赛数据包含两个部分。
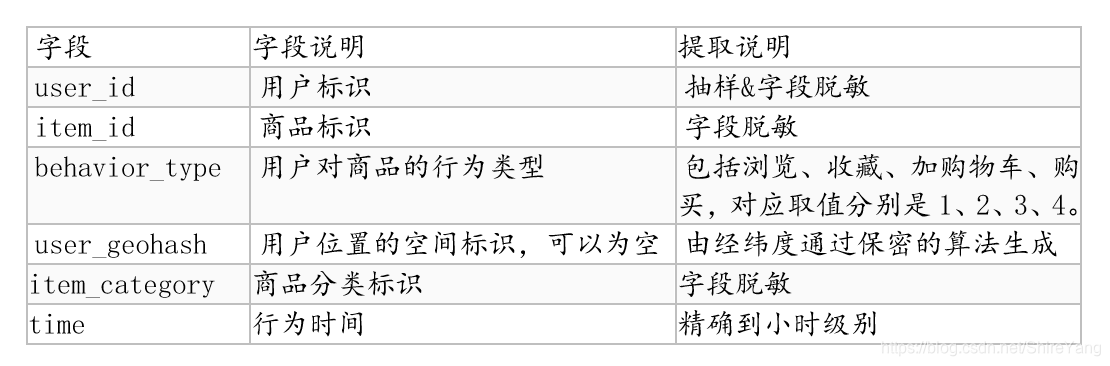
第一部分是用户在商品全集上的移动端行为数据(D),表名为tianchi_mobile_recommend_train_user,包含如下字段:
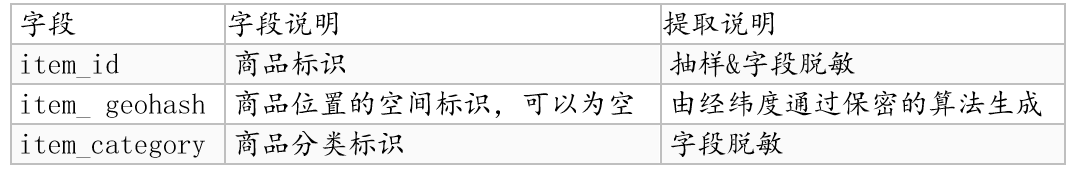
第二个部分是商品子集(P),表名为tianchi_mobile_recommend_train_item,包含如下字段:
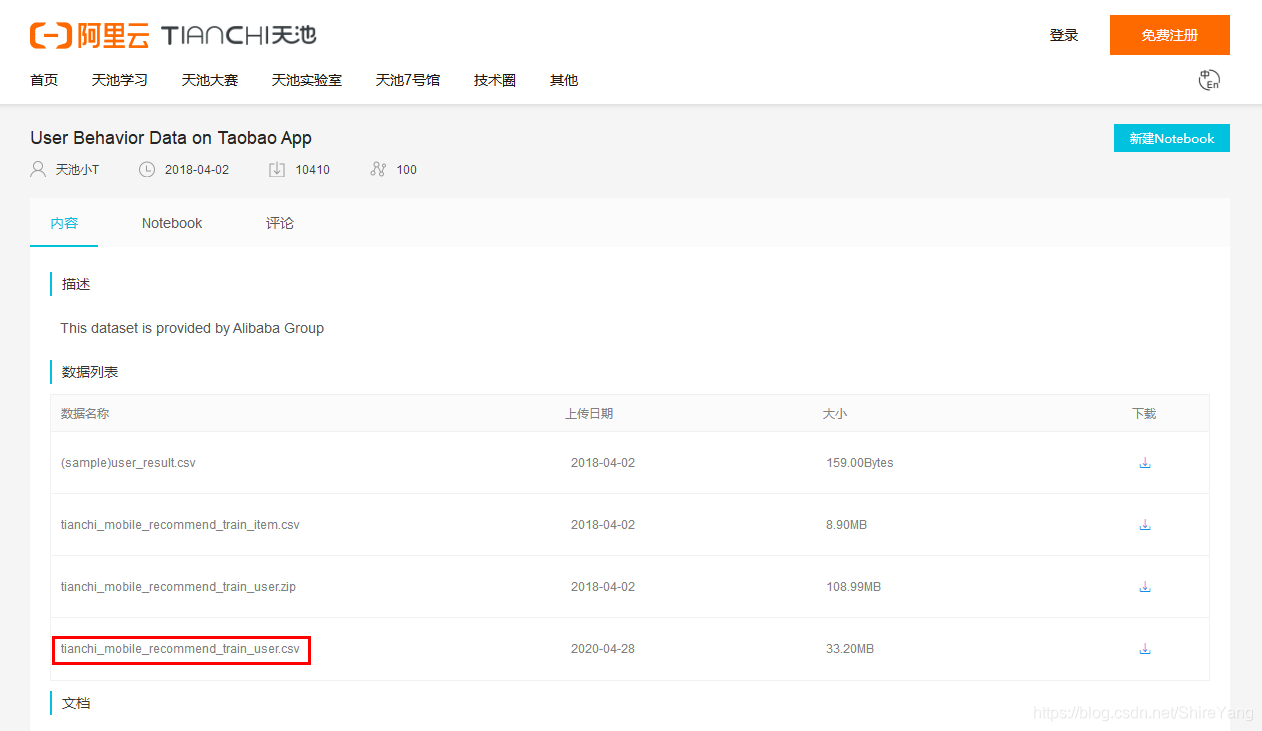
Zip文件中的数据集更大,有1225万。我用的是下图中的红框中的数据,33.2MB,共有80万条。
二、数据清洗
导入数据到mysql
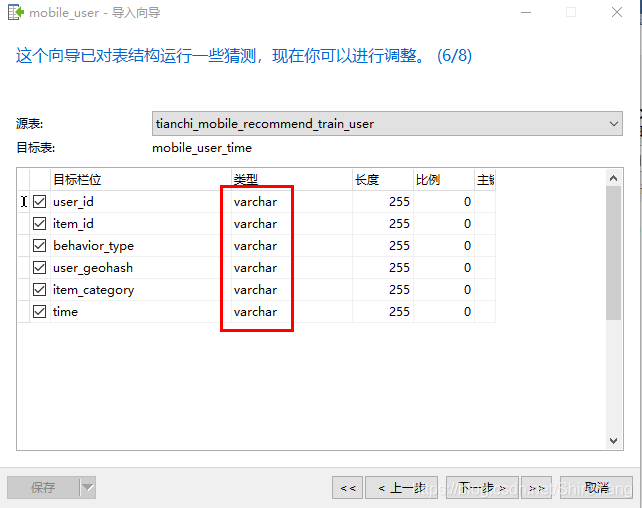
导入数据时,所有的字段都按照默认格式varchar导入▼,导入成功后再设计表,按照需求修改字段格式。
血泪教训 :第一次导入时,把time设置成了datetime格式,导入成功后time一列全部显示为0,后面又费了功夫把它给调对。
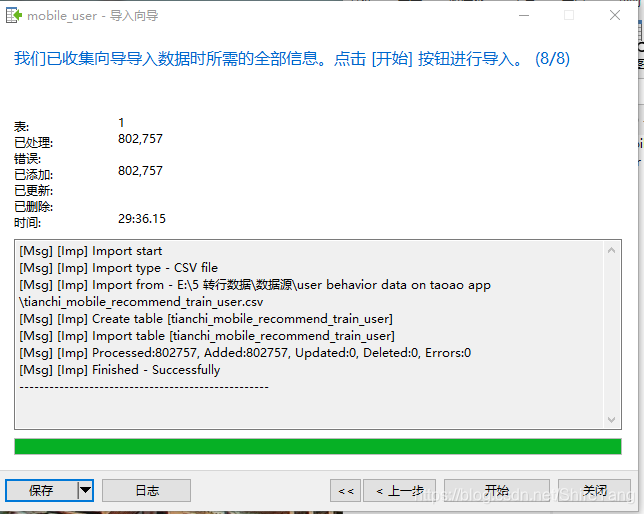
将80万条数据导入mysql,花费了30分钟,导入成功,点击关闭。▼
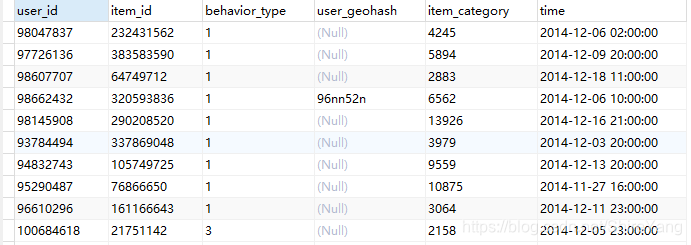
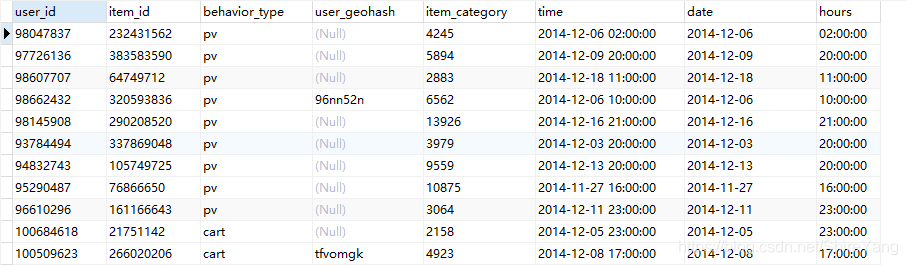
数据概览▼
重复值
有重复,但是根据业务理解,不需要作处理。代码如下:
select *, count(user_id) from data
group by user_id, item_id, behavior_type, item_id, time
having count(user_id) > 1;
异常值
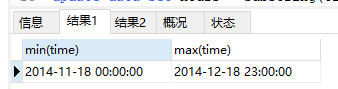
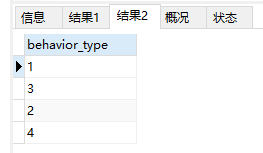
查看time的范围,behaviou_type的类型。代码如下:
select min(time), max(time) from data;
select distinct behavior_type from data;
缺失值
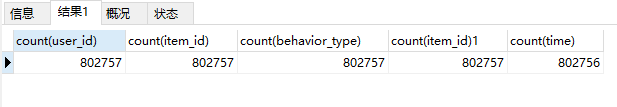
查看各字段的数量,发现time有一条缺失。代码如下:
select count(user_id), count(item_id), count(behavior_type),
count(item_id), count(time)
from data;
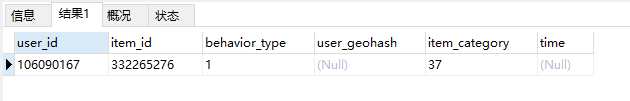
查看找到它,删除。代码如下:
select * from data where time is null;
delete from data where time is null;
数据一致化
对time字段分成日期date和时段hours两个字段;为了便于理解,把behavior_type的数字改为英文简写。代码如下:
# 把time分成date和hours两个字段,然后删除time
alter table data add column date date;
alter table data add column hours varchar(255);
update data set date = left(time, 10);
update data set hours = substring(time, 12,2);

# 把behavior_type 分别更名为pv, col, cart, buy
update data
set behavior_type = (
case
when behavior_type = 1 then 'pv'
when behavior_type = 2 then 'col'
when behavior_type = 3 then 'cart'
when behavior_type = 4 then 'buy'
else '其他'
end
);

# 删除time这一列
alter table data drop time;
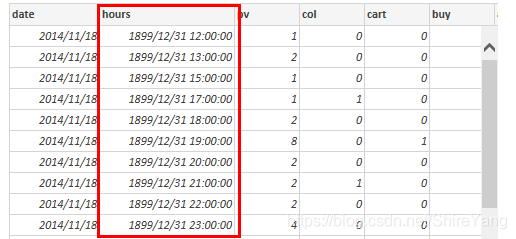
血泪教训:刚开始完全把hours设置成time格式,使用right(time, 8),最终结果显示为00:00:00的格式。但是,后来在使用powerbi可视化过程中发现,这样会出现一些如下图红框中的错误显示。最终决定,hours使用varchar格式,显示12、13、15、17这样的格式,方便可视化。错误代码如下,不要这样做:
# 错误示范
alter table data add column hours time;
update data set hours = right(time, 8);
三、数据分析
使用sql进行数据分析的过程,我把它理解为,理解业务,写代码,建视图,可视化。
视图命名规则基本按照【维度_度量】这样的格式,方便自己理解。命名基本用英文全称,少用简写,方便后续的理解与回顾。
1. 整体活跃度,基于AARRR模型
“获取(Acquisition)”、“激活(Activation)”、“留存(Retention)”、“传播(Referral)”、“收入(Revenue)”
1.1 用户获取Acquisition
代码参照后面的留存率day_0
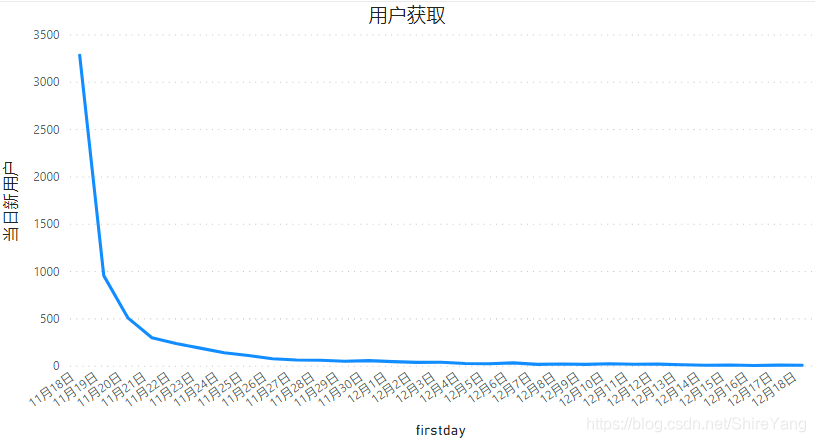
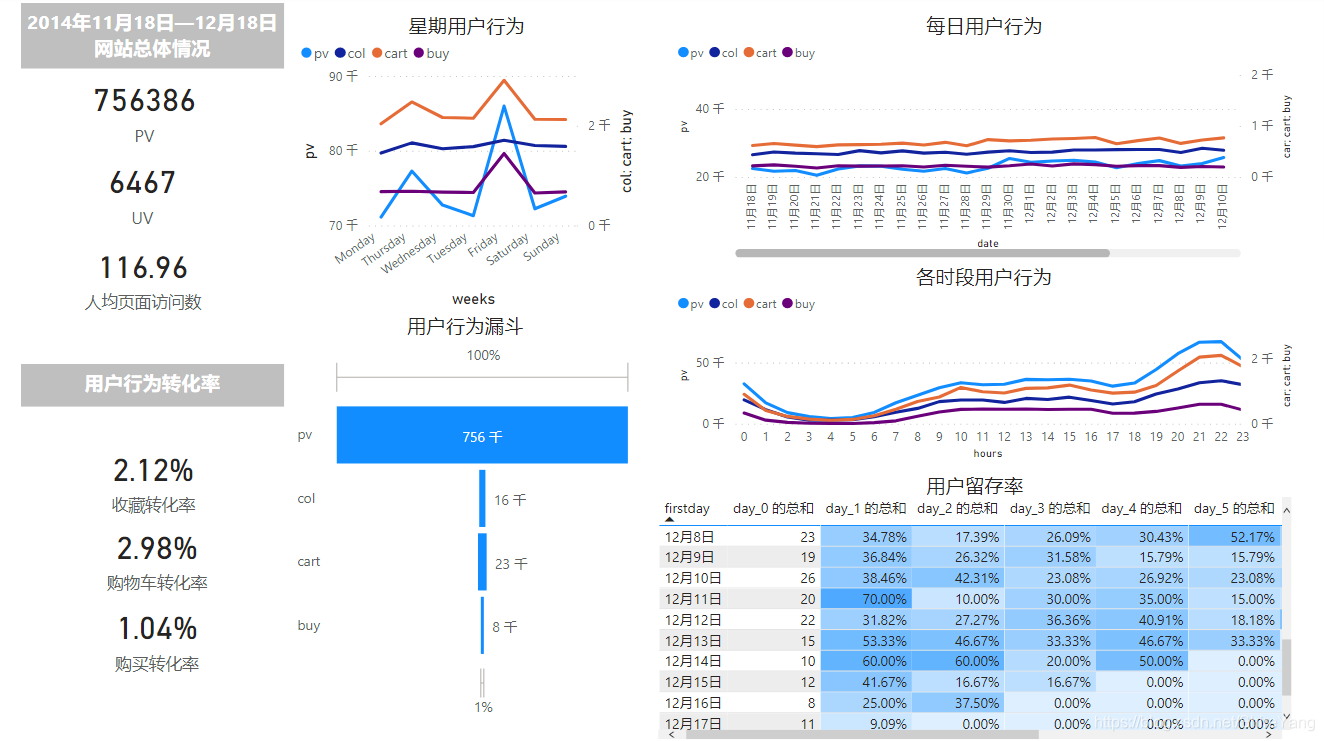
每日都有新增用户。11月18日—11月21日新增用户骤降,后续持续递减。▼
本项目数据从11月18日开始,到12月18日结束,11月18日前无可分析数据。在靠近11月18日的当日新增用户中很大一部分并非当日新增,而是18日前就已经活跃用户。日期靠后的数据,越能体现出当日新增真实值,具体值需要等待后续数据。
1.2 用户激活Activation
PV, UV
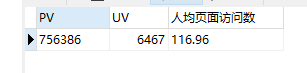
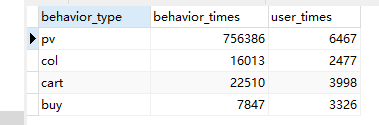
本项目数据源共802757条,pv为756386 ,uv为6467, 人均页面访问数为116.96。代码如下:
# 整体指标
create view whole_index as
select sum(user_pv) as PV, count(user_id) as UV, format(sum(user_pv)/count(user_id), 2) as 人均页面访问数
from (select user_id, count(behavior_type) as user_pv
from data where behavior_type = 'pv' group by user_id) as a;
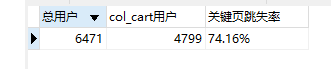
跳失率
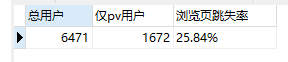
浏览页跳失率为25.84%,关键页跳失率74.16%。
跳失分析:商品不符合用户需求,竞争力不够。可对比竞品网站,在商品的定价、商品陈列故事、商品详情描述等方面做出改进。
代码如下:
-- 浏览页跳失率:用户仅仅有pv行为,没有其它的收藏、加购、购买行为,

create view view_bounce_rate as
select (select count(distinct user_id) from data) as 总用户,
count(distinct user_id) as 仅pv用户,
concat(format(count(distinct user_id)
/(select count(distinct user_id) from data)*100, 2), '%') as 浏览页跳失率
from data
where user_id not in
(select distinct user_id from data where behavior_type = 'col')
and user_id not in
(select distinct user_id from data where behavior_type = 'cart')
and user_id not in
(select distinct user_id from data where behavior_type = 'col');
-- 关键页跳失率:用户有收藏或加购行为但无购买
create view key_bounce_rate as
select (select count(distinct user_id) from data) as 总用户,
count(distinct user_id) as col_cart用户,
concat(format(count(distinct user_id)
/(select count(distinct user_id) from data)*100, 2), '%') as 关键页跳失率
from data
where user_id in
(select distinct user_id from data where behavior_type = 'col')
or user_id in
(select distinct user_id from data where behavior_type = 'cart')
and user_id not in
(select distinct user_id from data where behavior_type = 'col');
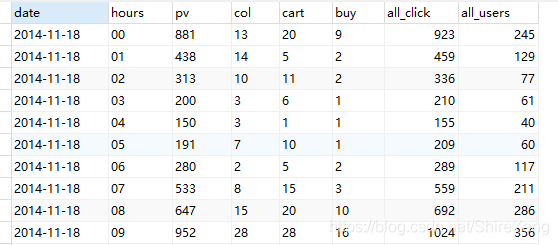
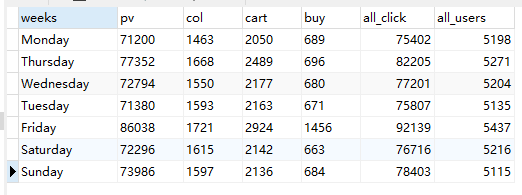
时间维度用户行为
从时间维度的日期、时段、星期,来观察用户行为。
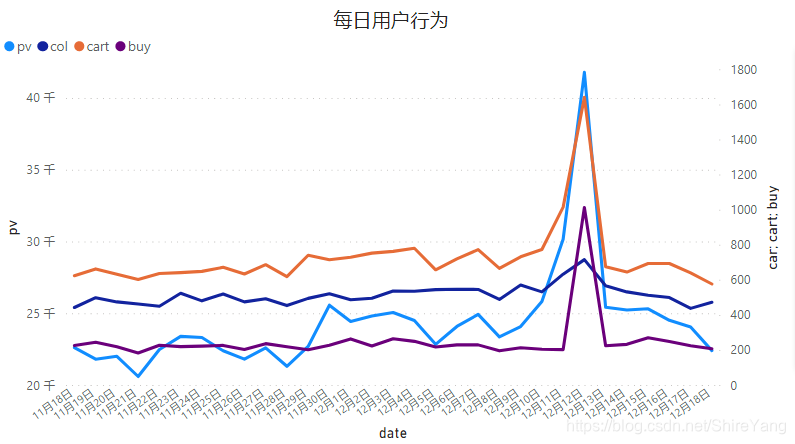
从11月30日开始,pv、cart值增大,12月5日、8日出现小范围减小;12月12日当天pv、cart、buy值激增,达到高点,次日骤降,回归平均水平。▼
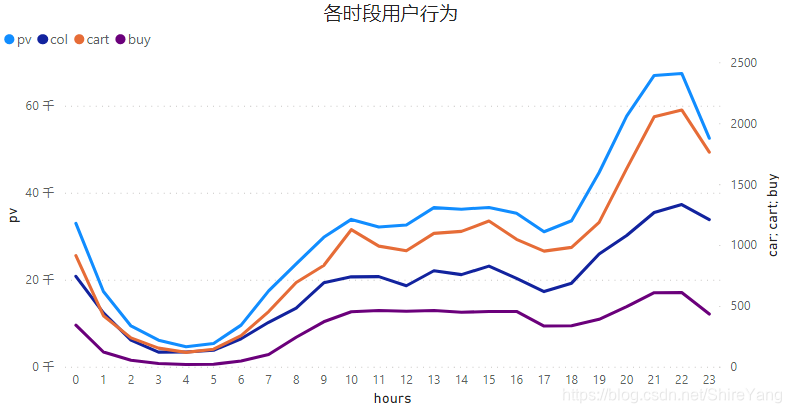
从日时段来看,用户在10点到24点较为活跃。从17点开始逐渐增高,晚上21点—22点达到最高值。▼
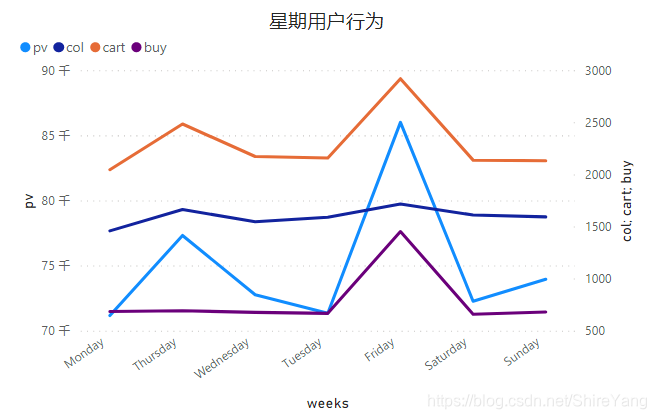
从星期来看,周二、周五分别有两个客流小高峰。▼
基于以上数据,12·12活动一般选择在11月底、12月初开始预热,至少提前1-2周进行;网站的客服、维护尤其要注意晚上20点—23点这一时段;日常的推新、促销选择在周二、周五进行。
代码如下:
# 每日、小时用户行为
create view dayhour_behavior_times as
select date, hours,
sum(case when behavior_type='pv' then 1 else 0 end) as pv,
sum(case when behavior_type='col' then 1 else 0 end) as col,
sum(case when behavior_type='cart' then 1 else 0 end) as cart,
sum(case when behavior_type='buy' then 1 else 0 end) as buy,
count(behavior_type) as all_click,
count(distinct user_id) as all_users
from data group by date, hours
order by date, hours;
# 周weeks用户行为,'%W' W必须大写,才会返回星期名。
create view weeks_behavior_times as
select date_format(date, '%W') as weeks,
sum(case when behavior_type='pv' then 1 else 0 end) as pv,
sum(case when behavior_type='col' then 1 else 0 end) as col,
sum(case when behavior_type='cart' then 1 else 0 end) as cart,
sum(case when behavior_type='buy' then 1 else 0 end) as buy,
count(behavior_type) as all_click,
count(distinct user_id) as all_users
from data
where date between '2014-11-23' and '2014-12-13'
group by weeks order by field(weeks, 'Monday', 'Thursday', 'Wednesday', 'Tuesday', 'Friday', 'Saturday', 'Sunday');
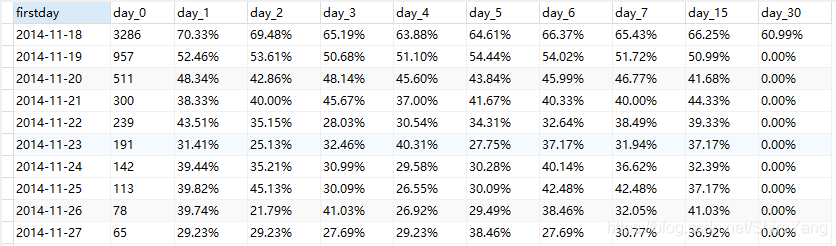
1.3 用户留存 Retention
留存率
为了排除11月18日前,未统计数据的影响。选择近一个月的中间日期,从12月3日开始看用户留存率。
12·12活动前后的用户留存率高于同期水平。从留存率看,预计12月18日后近期会有另外的促销活动开展。▼

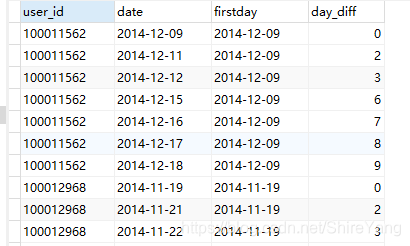
这一条是代码思路,供需要的朋友参考:
select user_id, date from data group by user_id, date; # 每个用户的活跃日期
select user_id, min(date) as firstday from data group by user_id; # 每个用户的第一次活跃日期
正式代码:
# 新建视图time_inter,上面的2表连接查询,并增加一列时间间隔。
create view time_inter as
select a.*, b.firstday, datediff(a.date, b.firstday) as day_diff from
(select user_id, date from data group by user_id, date) as a,
(select user_id, min(date) as firstday from data group by user_id) as b
where a.user_id = b.user_id order by user_id, date;
# 搭建留存天数模型retention_day,第一次活跃用户会持续活跃几天
create view retention_day as
select firstday,
sum(case when day_diff=0 then 1 else 0 end) as day_0,
sum(case when day_diff=1 then 1 else 0 end) as day_1,
sum(case when day_diff=2 then 1 else 0 end) as day_2,
sum(case when day_diff=3 then 1 else 0 end) as day_3,
sum(case when day_diff=4 then 1 else 0 end) as day_4,
sum(case when day_diff=5 then 1 else 0 end) as day_5,
sum(case when day_diff=6 then 1 else 0 end) as day_6,
sum(case when day_diff=7 then 1 else 0 end) as day_7,
sum(case when day_diff=15 then 1 else 0 end) as day_15,
sum(case when day_diff=30 then 1 else 0 end) as day_30
from time_inter
group by firstday
order by firstday;
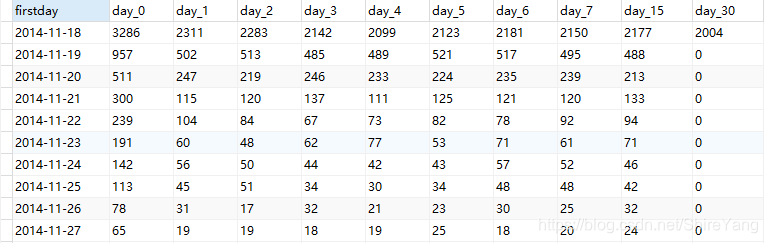
# 搭建留存率模型retention_rate
create view retention_rate as
select firstday, day_0,
concat(format(day_1/day_0*100, 2), '%') as day_1,
concat(format(day_2/day_0*100, 2), '%') as day_2,
concat(format(day_3/day_0*100, 2), '%') as day_3,
concat(format(day_4/day_0*100, 2), '%') as day_4,
concat(format(day_5/day_0*100, 2), '%') as day_5,
concat(format(day_6/day_0*100, 2), '%') as day_6,
concat(format(day_7/day_0*100, 2), '%') as day_7,
concat(format(day_15/day_0*100, 2), '%') as day_15,
concat(format(day_30/day_0*100, 2), '%') as day_30
from retention_day;
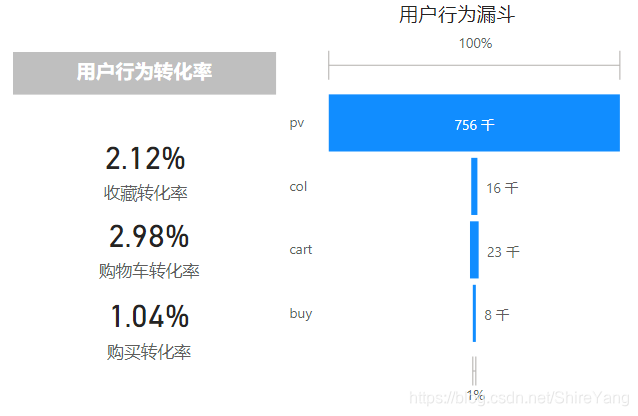
1.4 用户推荐Referral
本项目中的收藏col与加购cart的行为不是相互独立的,都是确定购买buy意向的行为,没有先后之分。因此,从浏览pv、加购cart、购买buy这一路径来简要分析。
从浏览到加购的转化率为2.98%,用户花了大量时间寻找合适的产品。可优化网站筛选、关键词搜索功能,推荐更适合用户的商品,方便用户迅速获取信息。
从加购到购买的转化率约为35%。可针对加购未购买产品细分,采用提供优惠券、推荐同款商品等促销方法。▼
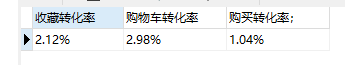
转化率
代码思路:
select count(behavior_type) from data where behavior_type = 'pv'; # 总pv
正式代码:
# 计算转化率conversion_rate
create view conversion_rate as
select
concat(format((select count(behavior_type) from data where behavior_type = 'col')
/(select count(behavior_type) from data where behavior_type = 'pv')*100, 2), '%') as 收藏转化率,
concat(format((select count(behavior_type) from data where behavior_type = 'cart')
/(select count(behavior_type) from data where behavior_type = 'pv')*100, 2), '%') as 购物车转化率,
concat(format((select count(behavior_type) from data where behavior_type = 'buy')
/(select count(behavior_type) from data where behavior_type = 'pv')*100, 2), '%') as 购买转化率;
漏斗模型
用户行为漏斗behavior_times,uv独立访客漏斗user_times。正式代码如下:
# 创建漏斗视图funnel_times
create view funnel_times as
select behavior_type, count(behavior_type) as behavior_times,
count(distinct user_id) as user_times from data group by behavior_type
order by field(behavior_type, 'pv', 'col', 'cart', 'buy');
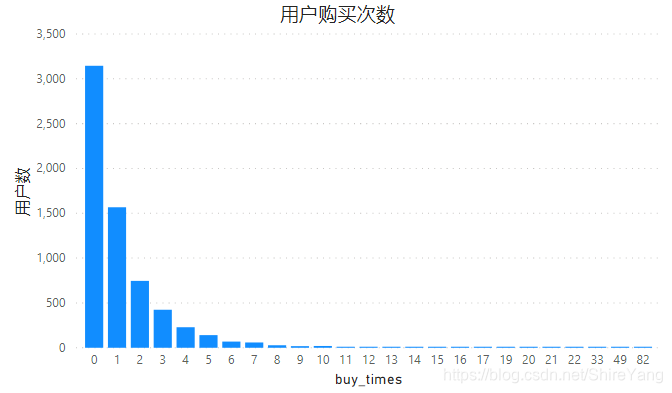
1.5 用户收益Revenue
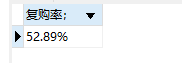
用户购买次数在1-5次,更高次数的用户很少,整体复购率为52.89%,相对可观,可将运营重点放在培养用户忠诚度上,从质量、价格、服务、物流等方面做出改进,鼓励用户更高频次的消费。▼
购买率
代码如下:
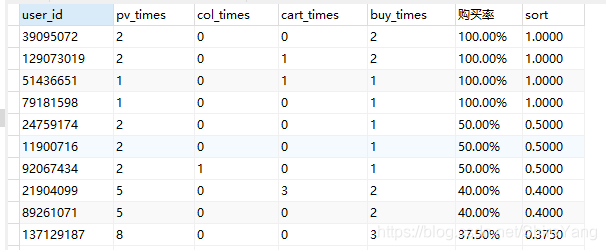
# 创建视图user_behavior_times,用户-行为分类明细表
create view user_behavior_times as
select user_id,
sum(case when behavior_type='pv' then 1 else 0 end) as pv_times,
sum(case when behavior_type='col' then 1 else 0 end) as col_times,
sum(case when behavior_type='cart' then 1 else 0 end) cart_times,
sum(case when behavior_type='buy' then 1 else 0 end) as buy_times,
concat(format(sum(case when behavior_type='buy' then 1 else 0 end)
/sum(case when behavior_type='pv' then 1 else 0 end)*100, 2), '%') as 购买率,
sum(case when behavior_type='buy' then 1 else 0 end)
/sum(case when behavior_type='pv' then 1 else 0 end) as sort
from data group by user_id order by sort desc;
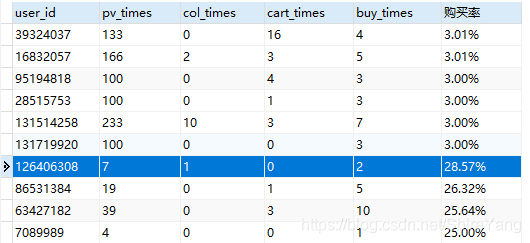
血泪教训:把购买率转换成百分比后,无法按照购买率直接进行排序。mysql的语法不支持按照百分比排序。因此需要新建一列sort来作为排序列。错误情况如下▼
复购率
代码思路:
select count(user_id) from user_behavior_times where buy_times>0; # 购买过的用户次数
select count(user_id) from user_behavior_times where buy_times>1; # 购买次数大于1的用户数
正式代码:
# 计算复购率
create view repurchase_rate as
select concat(format((select count(user_id) from user_behavior_times where buy_times>1)
/(select count(user_id) from user_behavior_times where buy_times>0)*100, 2), '%') as 复购率;
2. 商品销售情况
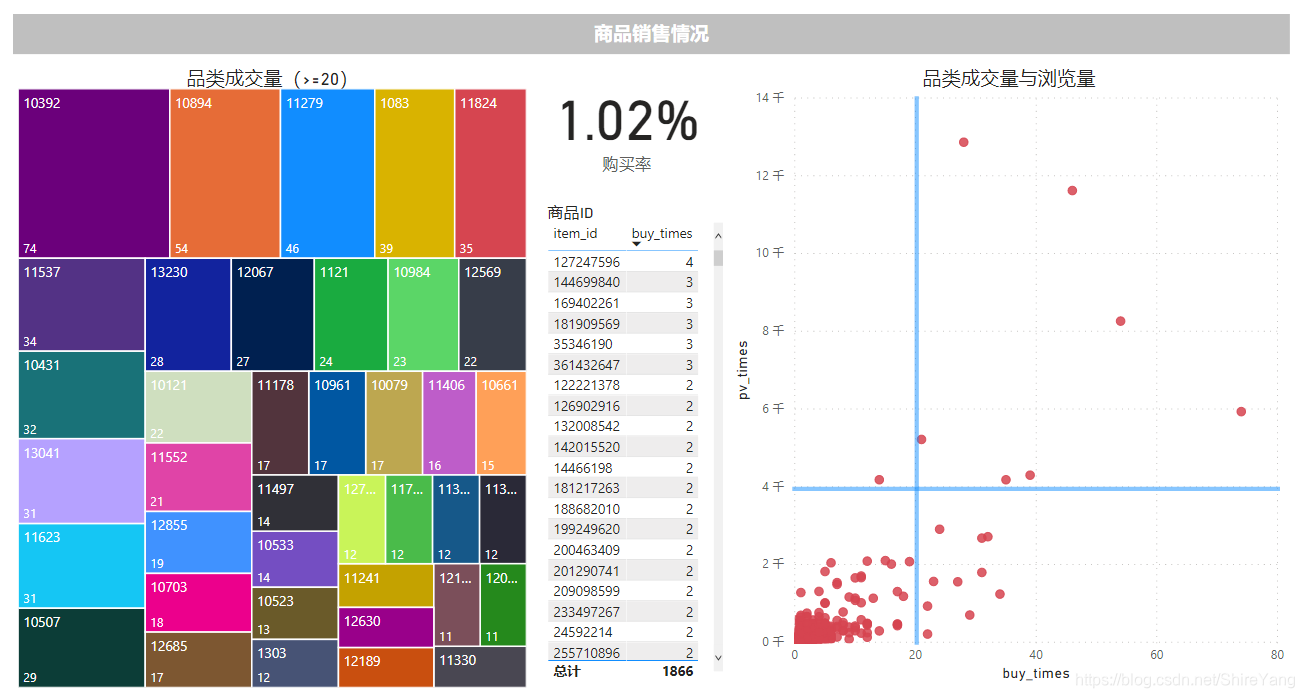
从购买次数,分析商品类别、商品id的受欢迎程度。
成交品类较高的是10392、1894、11279三大类。▼
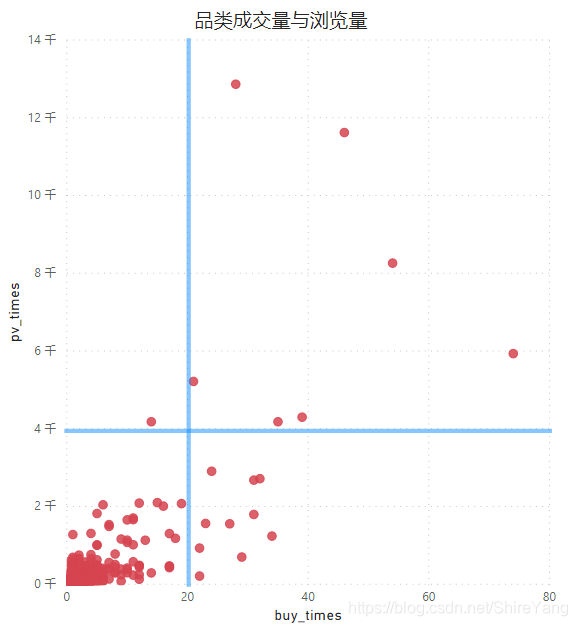
按照成交量与浏览量的高低,把商品类别分为四大类。
- pv低buy低,多数商品集中在这一类,商品存在替代性,可增加该类商品的客流量,以提高成交量;
- pv低buy高,商品是有竞争力的,可在活动中作为主打商品,提高复购率,同时增加宣传,打开市场、吸引新用户,营造品类口碑;
- pv高buy低,购买存在较大随机性,可在商品的描述、价格等方面做出改变,提升商品竞争力;
- pv高buy高,用户有较高需求,可提炼商品卖点、精简描述,方便用户更快做出购买决策。
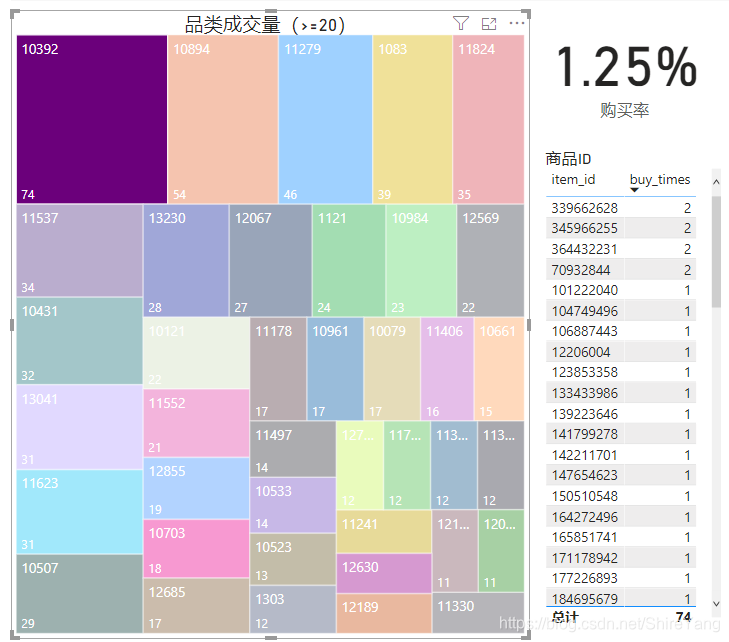
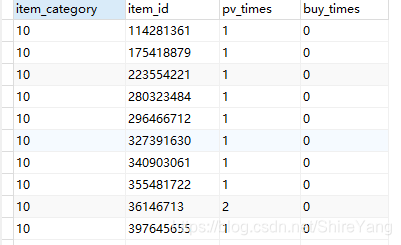
查看各品类及商品被购买次数,包括0次即没有成交记录,在可视化时可以,计算商品购买率,并按照需要筛选相应指标。
代码如下:
create view hot_item as
select item_category, item_id,
sum(case when behavior_type = 'pv' then 1 else 0 end) as pv_times,
sum(case when behavior_type = 'buy' then 1 else 0 end) as buy_times
from data
group by item_category, item_id order by item_category, item_id, buy_times;
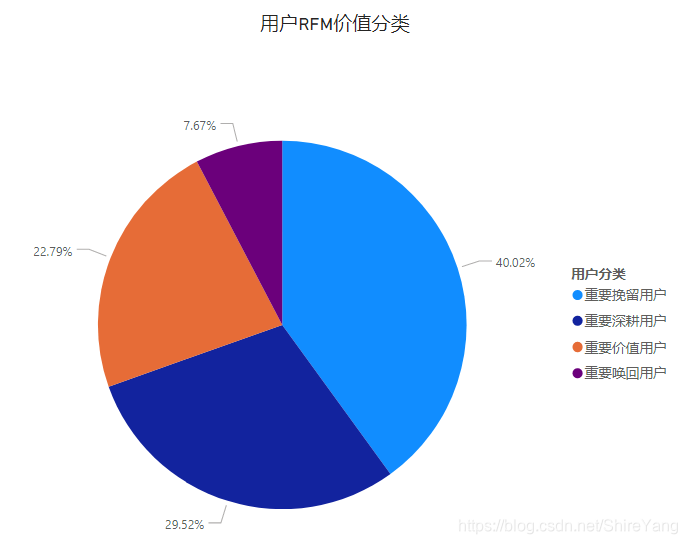
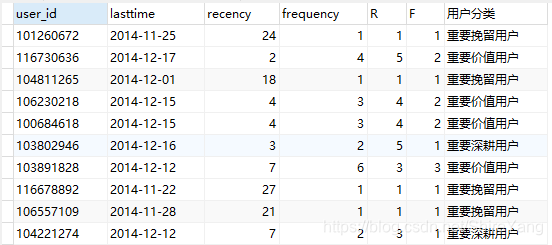
3. 用户价值,基于RFM模型
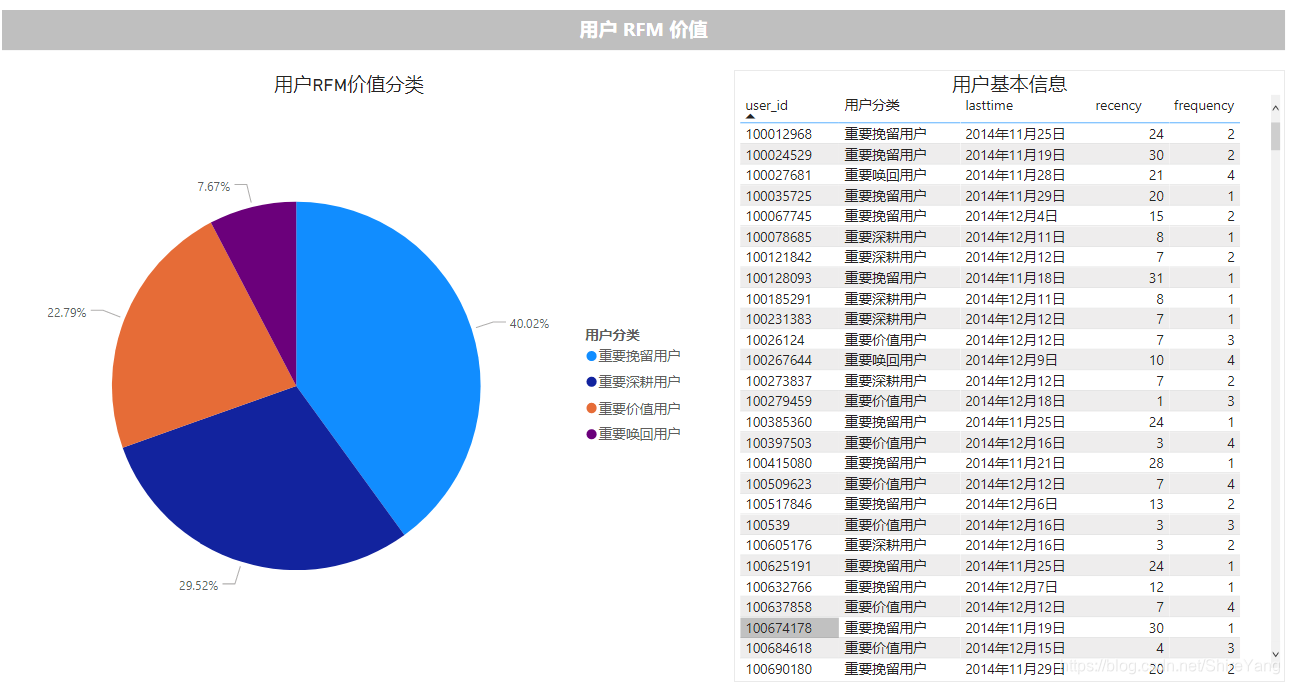
仅在会员(购买过商品的用户)范围内,进行价值划分,R/F等级为1-5,由于本项目的数据不涉及M(Monetary),所以只做4类划分。▼
通过RFM模型,了解每位顾客的特性,实现差异化营销。
- 重要价值用户,R高F高。经常在网站购物,并形成习惯,做好维护即可。
- 重要深耕用户,R高F低。这类用户粘性不强,近期有消费行为,可能是针对需要的商品直接下单,不会过于频繁地进行其他商品的浏览、购买。可推荐更符合用户喜好、性价比高商品,吸引其进行购买,逐渐建立消费习惯。
- 重要唤回用户,R低F高。最近没有购买行为,可以通过短信等场外提醒,引导其入场参与优惠活动,尽快完成下次购买行为。
- 重要挽留用户,R低F低。该类用户容易流失,占比40.02%,可提升空间大,运营活动可重点针对这部分用户,通过拼团打折、积分兑换、捆绑销售等活动唤起用户注意力,提升用户兴趣。
下面这一条是代码思路,分步骤理解,供需要的朋友参考:
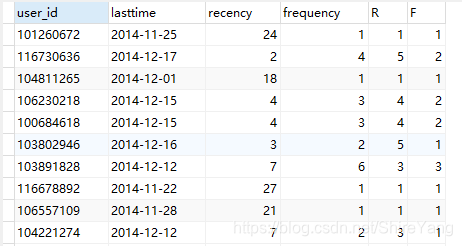
# 计算最近交易时间lasttime, 最后一次购买距今几天recency。2014-12-19是指本项目的分析日期,在实际项目中可以使用curdate()来返回当前日期。
create view recency as
select user_id, max(date) as 'lasttime', datediff('2014-12-19', max(date)) as recency
from data where behavior_type = 'buy'
group by user_id order by recency desc;

# 计算近1个月购买频率frequency
create view frequency as
select user_id, count(behavior_type) as frequency
from data where behavior_type = 'buy'
group by user_id order by frequency desc;

# 对recency从1-5划分等级R,可以根据业务理解相应修改。本项目选择3、6、9、12、更久。
create view r等级 as
select *, (case
when recency<=3 then 5
when recency<=6 then 4
when recency<=9 then 3
when recency<=12 then 2
else 1 end) as R
from recency;

# 对frequency从1-5划分等级F,本项目选择2、4、6、8、更久。
create view f等级 as
select *, (case
when frequency<=2 then 1
when frequency<=4 then 2
when frequency<=6 then 3
when frequency<=8 then 4
else 5 end) as F
from frequency;
正式代码如下:
# 计算R/F/M,本项目无M,省略
create view rfm as
select user_id,
max(date) as 'lasttime', datediff('2014-12-19', max(date)) as recency,
count(behavior_type) as frequency,
(case
when datediff('2014-12-19', max(date))<=3 then 5
when datediff('2014-12-19', max(date))<=6 then 4
when datediff('2014-12-19', max(date))<=9 then 3
when datediff('2014-12-19', max(date))<=12 then 2
else 1 end) as R ,
(case
when count(behavior_type)<=2 then 1
when count(behavior_type)<=4 then 2
when count(behavior_type)<=6 then 3
when count(behavior_type)<=8 then 4
else 5 end) as F
from data where behavior_type = 'buy'
group by user_id;
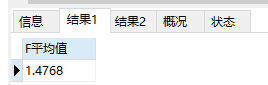
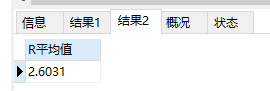
# 计算平均值
select avg(F) as F平均值 from rfm; # 1.4768
select avg(R) as R平均值 from rfm; # 2.6031
# 没有M,建立在购买量M大的前提下,对用户做出以下4类分类
create view rfm用户分类 as
select *,
(case
when R>2.6031 and F>1.4768 then '重要价值用户'
when R>2.6031 and F<1.4768 then '重要深耕用户'
when R<2.6031 and F>1.4768 then '重要唤回用户'
when R<2.6031 and F<1.4768 then '重要挽留用户'
end) as 用户分类
from rfm;
# 查看用户情况,可以验证上一步代码是否正确
select 用户分类, count(用户分类) from rfm用户分类
group by 用户分类;
题外代码:三个不同的用户数,理解思路。
select count(distinct(user_id)) from data; # 6471 所有用户
select count(distinct(user_id)) from data where behavior_type='buy'; # 3326
select count(distinct(user_id)) from data where behavior_type='pv'; # 6467
4. 导出数据
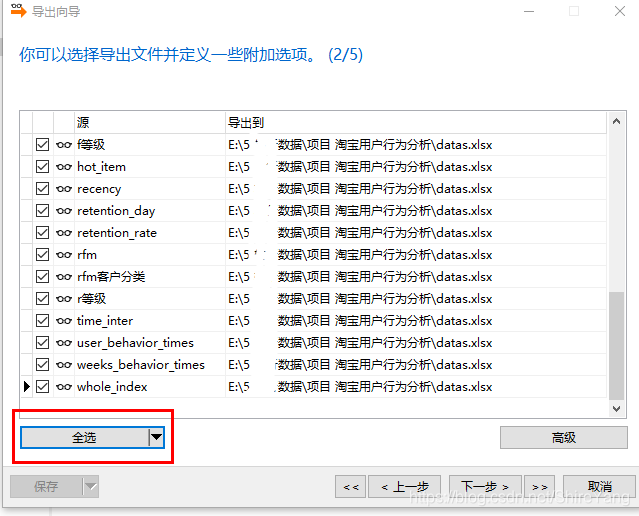
根据“导出向导”的提示操作,导出数据。在红框处选择“导出选择的到相同文件”,可以把需要进行可视化的数据,导出到一个文件中。▼
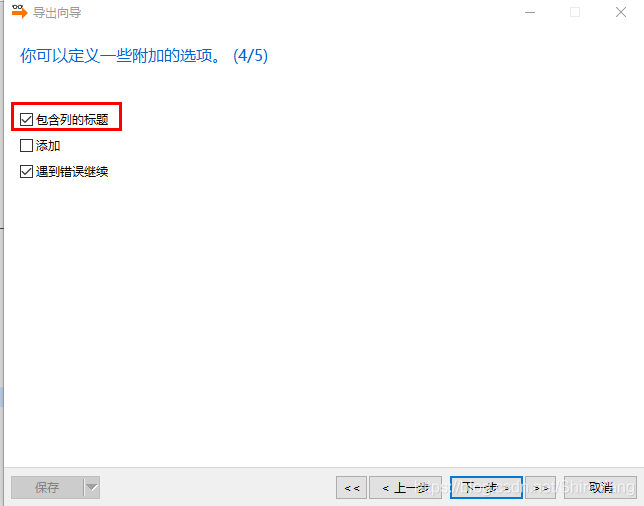
勾选“包含列的标题”,这样导出的数据会有列标题。不然是纯数据,不方便可视化操作。▼
导出数据,花了将近一个小时,忘了截图。这个时间可以用来写报告。
四、可视化看板及建议
关注总体指标,提升用户活跃度
对比竞品网站,在商品的定价、商品陈列故事、商品详情描述等方面做出改进,减少用户跳失。
大型活动至少提前1—2周进行预热,可活跃用户,提升用户留存率;网站维护、客服尤其要关注晚上20点—23点时段;日常的推新、促销可选择在周二、周五进行。
优化网站筛选、关键词搜索功能,推荐更适合用户的商品,方便用户迅速获取信息;针对加购未购买产品细分,采用提供优惠券、推荐同款商品等促销方法,提升用户行为转化率,促进更快、更顺利完成购买行为。
精准划分品类,促进商品成交
在成交品类较高的10392、1894、11279等大类后,可设置引流通道。对成交量高的品类,提炼可复用的营销方法。
对pv低buy低的商品,可增加其客流量,以期提高成交量;在活动中把pv低buy高的商品作为主打,提高复购率,打开市场、吸引新用户,借其增强品类口碑;针对pv高buy低的商品,在商品详情、价格等方面做出改变,提升商品竞争力;提炼pv高buy高的商品卖点、精简描述,引导用户更快做出购买决策,提升购买体验。
了解用户特性,差异化营销
做好重要价值用户的维护工作,推荐更符合重要深耕用户喜好、性价比高商品,吸引其进行购买,逐渐建立消费习惯。通过发送短信等场外提醒给重要唤回用户的方式,引导其入场参与优惠活动,尽快完成下次购买行为。运营活动可重点关注容易流失的重要挽留用户,通过拼团打折、积分兑换、捆绑销售等活动唤起用户注意力,帮助用户建立对平台的兴趣。
——————————**********———————————
以上就是本项目的全部内容了,欢迎留言更多探讨。
有问必答。(如果我知道)

- python基于淘宝历史数据的用户行为分析
- 淘宝用户行为分析-AARRR、RMF模型(数据量:百万级,工具mysql)
- 电商用户行为分析与挖掘(MYSQL数据分析+SPSS构建RFM模型)
- Spark项目之电商用户行为分析大数据平台之(六)用户访问session分析模块介绍
- Spark项目之电商用户行为分析大数据平台之(七)数据调研--基本数据结构介绍
- Spark项目之电商用户行为分析大数据平台之(十)IDEA项目搭建及工具类介绍
- 电商app用户行为分析(含全过程python代码)
- Spark大型项目实战:电商用户行为分析大数据平台
- 2019最新《Spark大型项目实战:电商用户行为分析大数据平台(高端大数据项目实战课程)》
- 淘宝关于用户行为的数据分析
- 数据分析实战项目:SQL分析淘宝用户行为
- Spark项目之电商用户行为分析大数据平台之(四)离线数据采集
- 电商用户行为分析大数据系统
- 2017云栖大会·杭州峰会:《在线用户行为分析:基于流式计算的数据处理及应用》之《数据可视化:构建实时动态运营数据分析大屏》篇
- Spark项目之电商用户行为分析大数据平台之(二)CentOS7集群搭建
- 基于网站日志数据挖掘的用户访问行为模式可视化研究
- spark大型项目实战:电商用户行为分析大数据平台(一)
- 基于spark的电商用户行为分析项目
- 网站用户行为数据统计与分析之一:埋点代码设计
- 电商用户行为分析大数据平台