[Pyhon疫情大数据分析] 一.腾讯实时数据爬取、Matplotlib和Seaborn可视化分析全国各地区、某省各城市、新增趋势
思来想去,虽然很忙,但还是挤时间针对这次肺炎疫情写个Python大数据分析系列博客,包括网络爬虫、可视化分析、GIS地图显示、情感分析、舆情分析、主题挖掘、威胁情报溯源、知识图谱、预测预警及AI和NLP应用等。希望该系列线上远程教学对您有所帮助,也希望早点战胜病毒,武汉加油、湖北加油、全国加油。待到疫情结束樱花盛开,这座英雄的城市等你们来。
第一篇文章将分享腾讯疫情实时数据抓取,获取全国各地和贵州省各地区的实时数据,并将数据存储至本地,最后调用Maplotlib和Seaborn绘制中国各地区、贵州省各城市、新增人数的图形。希望这篇可视化分析文章对您有所帮助,也非常感谢参考文献中老师的分享,一起加油,战胜疫情!如果您有想学习的知识或建议,可以给作者留言~
文章目录
- 一.Python实时数据爬取
- 二.Matplotlib绘制全国各地区柱状图
- 三.数据存储及Seaborn绘制全国各地区柱状图
- 四.Seaborn绘制全国各地区对比柱状图
- 五.Seaborn绘制疫情趋势图及湖北省内外对比图
- 六.Seaborn绘制其他图形及分析
- 七.贵州省可视化分析
- 八.总结
同时推荐前面作者另外五个Python系列文章。从2014年开始,作者主要写了三个Python系列文章,分别是基础知识、网络爬虫和数据分析。2018年陆续增加了Python图像识别和Python人工智能专栏。
- Python基础知识系列:Python基础知识学习与提升
- Python网络爬虫系列:Python爬虫之Selenium+BeautifulSoup+Requests
- Python数据分析系列:知识图谱、web数据挖掘及NLP
- Python图像识别系列:Python图像处理及图像识别
- Python人工智能系列:Python人工智能及知识图谱实战

一.Python实时数据爬取
我们的目标网站是腾讯新闻网实时数据,其原理主要是通过Requests获取Json请求,从而得到各省、各市的疫情数据,这里推荐三篇原理文章,也强烈推荐大家阅读许老师(天元浪子)的博客。
爬虫目标网站:
推荐参考文章:
- Python实战:抓肺炎疫情实时数据,画2019-nCoV疫情地图 - 许老师-
- 用Python抓新型冠状病毒肺炎疫情数据,绘制全国疫情分布图 - shineych老师
- 2020Python开发者日:爬虫框架的技术实现与模块应用的经验分享 - 许老师
第一步 分析网站
通过浏览器“审查元素”查看源代码及“网络”反馈的消息,如下图所示:

对应的响应信息如下所示:

第二步 发送请求并获取Json数据
通过分析url地址、请求方法、参数及响应格式,可以获取Json数据,注意url需要增加一个时间戳。下面代码展示了获取数据的键值及34个省份。
# -*- coding: utf-8 -*-

#------------------------------------------------------------------------------
# 第一步:抓取数据
# 参考文章:许老师博客 https://www.geek-share.com/detail/2791598417.html
#------------------------------------------------------------------------------
import time, json, requests
# 抓取腾讯疫情实时json数据
url = 'https://view.inews.qq.com/g2/getOnsInfo?name=disease_h5&callback=&_=%d'%int(time.time()*1000)
data = json.loads(requests.get(url=url).json()['data'])
print(data)
print(data.keys())

# 统计省份信息(34个省份 湖北 广东 河南 浙江 湖南 安徽....)
num = data['areaTree'][0]['children']
print(len(num))
for item in num:
print(item['name'],end=" ")   # 不换行
else:
print("\n")                     # 换行
输出结果如下图所示,其顺序按照确诊人数排序。

第三步 获取湖北省疫情数据
接着通过 num[0][‘children’] 获取湖北省的疫情数据,代码如下:
# -*- coding: utf-8 -*-

#------------------------------------------------------------------------------
# 第一步:抓取数据
# 参考文章:许老师博客 https://www.geek-share.com/detail/2791598417.html
#------------------------------------------------------------------------------
import time, json, requests
# 抓取腾讯疫情实时json数据
url = 'https://view.inews.qq.com/g2/getOnsInfo?name=disease_h5&callback=&_=%d'%int(time.time()*1000)
data = json.loads(requests.get(url=url).json()['data'])
print(data)
print(data.keys())

# 统计省份信息(34个省份 湖北 广东 河南 浙江 湖南 安徽....)
num = data['areaTree'][0]['children']
print(len(num))
for item in num:
print(item['name'],end=" ")   # 不换行
else:
print("\n")                     # 换行
# 显示湖北省数据
hubei = num[0]['children']
for data in hubei:
print(data)
同样的方法可以获取各省份的数据,比如 num[1][‘children’] 表示广东省疫情数据,我们设置循环就能获取所有数据。其数据包括当日数据(today)和累计数据(total),confirm表示确诊、suspect表示疑似、dead表示死亡、heal表示治愈。

我们将所抓取的数据和真实的数据进行对比,武汉截止2月13日下午4点,新增确诊人数13436、累计确诊32994,发现是完全一致的。
{'name': '武汉',
'today': {'confirm': 13436, 'suspect': 0, 'dead': 0, 'heal': 0, 'isUpdated': True},
'total': {'confirm': 32994, <
1b5d7
span class="token string">'suspect': 0, 'dead': 1036, 'heal': 1915, 'showRate': False,
'showHeal': False, 'deadRate': 3.14, 'healRate': 5.8}}

第四步 获取各省确诊人数
注意,初始化每个省份人数为0,然后循环累加该省所有城市的确诊人数,调用 city_data[‘total’][‘confirm’] 获取各城市的确诊数据。
# -*- coding: utf-8 -*-

#------------------------------------------------------------------------------
# 第一步:抓取数据
# 参考文章:许老师博客 https://www.geek-share.com/detail/2791598417.html
#------------------------------------------------------------------------------
import time, json, requests
# 抓取腾讯疫情实时json数据
url = 'https://view.inews.qq.com/g2/getOnsInfo?name=disease_h5&callback=&_=%d'%int(time.time()*1000)
data = json.loads(requests.get(url=url).json()['data'])
print(data)
print(data.keys())

# 统计省份信息(34个省份 湖北 广东 河南 浙江 湖南 安徽....)
num = data['areaTree'][0]['children']
print(len(num))
for item in num:
print(item['name'],end=" ")   # 不换行
else:
print("\n")                     # 换行
# 显示湖北省数据
hubei = num[0]['children']
for item in hubei:
print(item)
else:
print("\n")

# 解析数据(确诊 疑似 死亡 治愈)
total_data = {}
for item in num:
if item['name'] not in total_data:
total_data.update({item['name']:0})
for city_data in item['children']:
total_data[item['name']] +=int(city_data['total']['confirm'])
print(total_data)
# {'湖北': 48206, '广东': 1241, '河南': 1169, '浙江': 1145, '湖南': 968, ...,  '澳门': 10, '西藏': 1}
输出结果如下图所示:

接下来我们分享可视化画图。
二.Matplotlib绘制全国各地区柱状图
首先,我们调用Matplotlib绘制全国各地区的确诊人数柱状图,帮助大家回忆其基本用法。total_data为字典变量键值对,比如{‘湖北’: 48206, ‘广东’: 1241,…}
# -*- coding: utf-8 -*-

#------------------------------------------------------------------------------
# 第一步:抓取数据
#------------------------------------------------------------------------------
import time, json, requests
# 抓取腾讯疫情实时json数据
url = 'https://view.inews.qq.com/g2/getOnsInfo?name=disease_h5&callback=&_=%d'%int(time.time()*1000)
data = json.loads(requests.get(url=url).json()['data'])
print(data)
print(data.keys())

# 统计省份信息(34个省份 湖北 广东 河南 浙江 湖南 安徽....)
num = data['areaTree'][0]['children']
print(len(num))
for item in num:
print(item['name'],end=" ")   # 不换行
else:
print("\n")                     # 换行

# 显示湖北省数据
hubei = num[0]['children']
for item in hubei:
print(item)
else:
print("\n")

# 解析数据(确诊 疑似 死亡 治愈)
total_data = {}
for item in num:
if item['name'] not in total_data:
total_data.update({item['name']:0})
for city_data in item['children']:
total_data[item['name']] +=int(city_data['total']['confirm'])
print(total_data)
# {'湖北': 48206, '广东': 1241, '河南': 1169, '浙江': 1145, '湖南': 968, ...,  '澳门': 10, '西藏': 1}

#------------------------------------------------------------------------------
# 第二步:绘制柱状图
#------------------------------------------------------------------------------
import matplotlib.pyplot as plt
import numpy as np

plt.rcParams['font.sans-serif'] = ['SimHei']  #用来正常显示中文标签
plt.rcParams['axes.unicode_minus'] = False    #用来正常显示负号

#获取数据
names = total_data.keys()
nums = total_data.values()
print(names)
print(nums)

# 绘图
plt.figure(figsize=[10,6])
plt.bar(names, nums, width=0.3, color='green')

# 设置标题
plt.xlabel("地区", fontproperties='SimHei', size=12)
plt.ylabel("人数", fontproperties='SimHei', rotation=90, size=12)
plt.title("全国疫情确诊数对比图", fontproperties='SimHei', size=16)
plt.xticks(list(names), fontproperties='SimHei', rotation=-45, size=10)
# 显示数字
for a, b in zip(list(names), list(nums)):
plt.text(a, b, b, ha='center', va='bottom', size=6)
plt.show()
输出结果如下图所示:

那么,如果我想获取累计确诊人数、新增确诊人数、死亡人数和治愈人数,并进行可视化展示,怎么办呢?只需要简单替换参数即可。
- city_data[‘total’][‘confirm’] 确诊人数
- city_data[‘total’][‘suspect’] 疑似人数
- city_data[‘total’][‘dead’] 死亡人数
- city_data[‘total’][‘heal’] 治愈人数
- city_data[‘today’][‘confirm’] 新增确诊人数
# -*- coding: utf-8 -*-

#------------------------------------------------------------------------------
# 第一步:抓取数据
#------------------------------------------------------------------------------
import time, json, requests
# 抓取腾讯疫情实时json数据
url = 'https://view.inews.qq.com/g2/getOnsInfo?name=disease_h5&callback=&_=%d'%int(time.time()*1000)
data = json.loads(requests.get(url=url).json()['data'])
print(data)
print(data.keys())

# 统计省份信息(34个省份 湖北 广东 河南 浙江 湖南 安徽....)
num = data['areaTree'][0]['children']
print(len(num))
for item in num:
print(item['name'],end=" ")   # 不换行
else:
print("\n")                     # 换行

# 显示湖北省数据
hubei = num[0]['children']
for item in hubei:
print(item)
else:
print("\n")

# 解析确诊数据
total_data = {}
for item in num:
if item['name'] not in total_data:
total_data.update({item['name']:0})
for city_data in item['children']:
total_data[item['name']] +=int(city_data['total']['confirm'])
print(total_data)
# {'湖北': 48206, '广东': 1241, '河南': 1169, '浙江': 1145, '湖南': 968, ...,  '澳门': 10, '西藏': 1}

# 解析疑似数据
total_suspect_data = {}
for item in num:
if item['name'] not in total_suspect_data:
total_suspect_data.update({item['name']:0})
for city_data in item['children']:
total_suspect_data[item['name']] +=int(city_data['total']['suspect'])
print(total_suspect_data)

# 解析死亡数据
total_dead_data = {}
for item in num:
if item['name'] not in total_dead_data:
total_dead_data.update({item['name']:0})
for city_data in item['children']:
total_dead_data[item['name']] +=int(city_data['total']['dead'])
print(total_dead_data)

# 解析治愈数据
total_heal_data = {}
for item in num:
if item['name'] not in total_heal_data:
total_heal_data.update({item['name']:0})
for city_data in item['children']:
total_heal_data[item['name']] +=int(city_data['total']['heal'])
print(total_heal_data)

# 解析新增确诊数据
total_new_data = {}
for item in num:
if item['name'] not in total_new_data:
total_new_data.update({item['name']:0})
for city_data in item['children']:
total_new_data[item['name']] +=int(city_data['today']['confirm']) # today
print(total_new_data)

#------------------------------------------------------------------------------
# 第二步:绘制柱状图
#------------------------------------------------------------------------------
import matplotlib.pyplot as plt
import numpy as np

plt.figure(figsize=[10,6])
plt.rcParams['font.sans-serif'] = ['SimHei']  #用来正常显示中文标签
plt.rcParams['axes.unicode_minus'] = False    #用来正常显示负号

#-----------------------------1.绘制确诊数据-----------------------------------
p1 = plt.subplot(221)

# 获取数据
names = total_data.keys()
nums = total_data.values()
print(names)
print(nums)
print(total_data)
plt.bar(names, nums, width=0.3, color='green')

# 设置标题
plt.ylabel("确诊人数", rotation=90)
plt.xticks(list(names), rotation=-60, size=8)
# 显示数字
for a, b in zip(list(names), list(nums)):
plt.text(a, b, b, ha='center', va='bottom', size=6)
plt.sca(p1)

#-----------------------------2.绘制新增确诊数据-----------------------------------
p2 = plt.subplot(222)
names = total_new_data.keys()
nums = total_new_data.values()
print(names)
print(nums)
plt.bar(names, nums, width=0.3, color='yellow')
plt.ylabel("新增确诊人数", rotation=90)
plt.xticks(list(names), rotation=-60, size=8)
# 显示数字
for a, b in zip(list(names), list(nums)):
plt.text(a, b, b, ha='center', va='bottom', size=6)
plt.sca(p2)

#-----------------------------3.绘制死亡数据-----------------------------------
p3 = plt.subplot(223)
names = total_dead_data.keys()
nums = total_dead_data.values()
print(names)
print(nums)
plt.bar(names, nums, width=0.3, color='blue')
plt.xlabel("地区")
plt.ylabel("死亡人数", rotation=90)
plt.xticks(list(names), rotation=-60, size=8)
for a, b in zip(list(names), list(nums)):
plt.text(a, b, b, ha='center', va='bottom', size=6)
plt.sca(p3)

#-----------------------------4.绘制治愈数据-----------------------------------
p4 = plt.subplot(224)
names = total_heal_data.keys()
nums = total_heal_data.values()
print(names)
print(nums)
plt.bar(names, nums, width=0.3, color='red')
plt.xlabel("地区")
plt.ylabel("治愈人数", rotation=90)
plt.xticks(list(names), rotation=-60, size=8)
for a, b in zip(list(names), list(nums)):
plt.text(a, b, b, ha='center', va='bottom', size=6)
plt.sca(p4)
plt.show()
输出如下图所示,但是Matplotlib画图不太美观,接下来分享Seaborn可视化。

三.数据存储及Seaborn绘制全国各地区柱状图
Seaborn是在Matplotlib的基础上进行了更高级的API封装,从而使得作图更加容易,在大多数情况下使用seaborn能做出很具有吸引力的图,而使用matplotlib就能制作具有更多特色的图。
- 安装:pip install seaborn

1.文件写入
# -*- coding: utf-8 -*-
#------------------------------------------------------------------------------
# 第一步:抓取数据
#------------------------------------------------------------------------------
import time, json, requests
# 抓取腾讯疫情实时json数据
url = 'https://view.inews.qq.com/g2/getOnsInfo?name=disease_h5&callback=&_=%d'%int(time.time()*1000)
data = json.loads(requests.get(url=url).json()['data'])
print(data)
print(data.keys())

# 统计省份信息(34个省份 湖北 广东 河南 浙江 湖南 安徽....)
num = data['areaTree'][0]['children']
print(len(num))
for item in num:
print(item['name'],end=" ")   # 不换行
else:
print("\n")                     # 换行

# 显示湖北省数据
hubei = num[0]['children']
for item in hubei:
print(item)
else:
print("\n")

# 解析确诊数据
total_data = {}
for item in num:
if item['name'] not in total_data:
total_data.update({item['name']:0})
for city_data in item['children']:
total_data[item['name']] +=int(city_data['total']['confirm'])
print(total_data)
# {'湖北': 48206, '广东': 1241, '河南': 1169, '浙江': 1145, '湖南': 968, ...,  '澳门': 10, '西藏': 1}

# 解析疑似数据
total_suspect_data = {}
for item in num:
if item['name'] not in total_suspect_data:
total_suspect_data.update({item['name']:0})
for city_data in item['children']:
total_suspect_data[item['name']] +=int(city_data['total']['suspect'])
print(total_suspect_data)

# 解析死亡数据
total_dead_data = {}
for item in num:
if item['name'] not in total_dead_data:
total_dead_data.update({item['name']:0})
for city_data in item['children']:
total_dead_data[item['name']] +=int(city_data['total']['dead'])
print(total_dead_data)

# 解析治愈数据
total_heal_data = {}
for item in num:
if item['name'] not in total_heal_data:
total_heal_data.update({item['name']:0})
for city_data in item['children']:
total_heal_data[item['name']] +=int(city_data['total']['heal'])
print(total_heal_data)

# 解析新增确诊数据
total_new_data = {}
for item in num:
if item['name'] not in total_new_data:
total_new_data.update({item['name']:0})
for city_data in item['children']:
total_new_data[item['name']] +=int(city_data['today']['confirm']) # today
print(total_new_data)

#------------------------------------------------------------------------------
# 第二步:存储数据至CSV文件
#------------------------------------------------------------------------------
names = list(total_data.keys())          # 省份名称
num1 = list(total_data.values())         # 确诊数据
num2 = list(total_suspect_data.values()) # 疑似数据(全为0)
num3 = list(total_dead_data.values())    # 死亡数据
num4 = list(total_heal_data.values())    # 治愈数据
num5 = list(total_new_data.values())     # 新增确诊病例
print(names)
print(num1)
print(num2)
print(num3)
print(num4)
print(num5)

# 获取当前日期命名(2020-02-13-all.csv)
n = time.strftime("%Y-%m-%d") + "-all.csv"
fw = open(n, 'w', encoding='utf-8')
fw.write('province,confirm,dead,heal,new_confirm\n')
i = 0
while i<len(names):
fw.write(names[i]+','+str(num1[i])+','+str(num3[i])+','+str(num4[i])+','+str(num5[i])+'\n')
i = i + 1
else:
print("Over write file!")
fw.close()
存储成功之后,如下图所示。

对应腾讯的数据,如下图所示:

2.Seaborn绘制柱状图
# -*- coding: utf-8 -*-
#------------------------------------------------------------------------------
# 第三步:调用Seaborn绘制柱状图
#------------------------------------------------------------------------------
import time
import matplotlib
import numpy as np
import seaborn as sns
import pandas as pd
import matplotlib.pyplot as plt

# 读取数据
n = time.strftime("%Y-%m-%d") + "-all.csv"
data = pd.read_csv(n)

# 设置窗口
fig, ax = plt.subplots(1,1)
print(data['province'])

# 设置绘图风格及字体
sns.set_style("whitegrid",{'font.sans-serif':['simhei','Arial']})

# 绘制柱状图
g = sns.barplot(x="province", y="confirm", data=data, ax=ax,
palette=sns.color_palette("hls", 8))

# 在柱状图上显示数字
i = 0
for index, b in zip(list(data['province']), list(data['confirm'])):
g.text(i+0.05, b+0.05, b, color="black", ha="center", va='bottom', size=6)
i = i + 1

# 设置Axes的标题
ax.set_title('全国疫情最新情况')

# 设置坐标轴文字方向
ax.set_xticklabels(ax.get_xticklabels(), rotation=-60)

# 设置坐标轴刻度的字体大小
ax.tick_params(axis='x',labelsize=8)
ax.tick_params(axis='y',labelsize=8)

plt.show()
显示结果如下图所示:

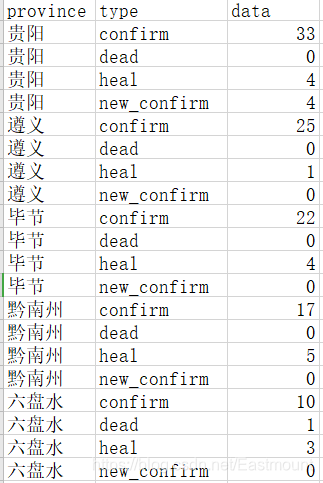
四.Seaborn绘制全国各地区对比柱状图
如果需要显示多个数据对比,则需要使用下面的代码。由于Seaborn能够进行按类别分组绘图,我们需要将抓取的数据存储为如下图所示的文件,才能将数据绘制在同一张图中。

# -*- coding: utf-8 -*-
#------------------------------------------------------------------------------
# 第一步:抓取数据
#------------------------------------------------------------------------------
import time, json, requests
# 抓取腾讯疫情实时json数据
url = 'https://view.inews.qq.com/g2/getOnsInfo?name=disease_h5&callback=&_=%d'%int(time.time()*1000)
data = json.loads(requests.get(url=url).json()['data'])
print(data)
print(data.keys())

# 统计省份信息(34个省份 湖北 广东 河南 浙江 湖南 安徽....)
num = data['areaTree'][0]['children']
print(len(num))
for item in num:
print(item['name'],end=" ")   # 不换行
else:
print("\n")                     # 换行

# 显示湖北省数据
hubei = num[0]['children']
for item in hubei:
print(item)
else:
print("\n")

# 解析确诊数据
total_data = {}
for item in num:
if item['name'] not in total_data:
total_data.update({item['name']:0})
for city_data in item['children']:
total_data[item['name']] +=int(city_data['total']['confirm'])
print(total_data)
# {'湖北': 48206, '广东': 1241, '河南': 1169, '浙江': 1145, '湖南': 968, ...,  '澳门': 10, '西藏': 1}

# 解析疑似数据
total_suspect_data = {}
for item in num:
if item['name'] not in total_suspect_data:
total_suspect_data.update({item['name']:0})
for city_data in item['children']:
total_suspect_data[item['name']] +=int(city_data['total']['suspect'])
print(total_suspect_data)

# 解析死亡数据
total_dead_data = {}
for item in num:
if item['name'] not in total_dead_data:
total_dead_data.update({item['name']:0})
for city_data in item['children']:
total_dead_data[item['name']] +=int(city_data['total']['dead'])
print(total_dead_data)

# 解析治愈数据
total_heal_data = {}
for item in num:
if item['name'] not in total_heal_data:
total_heal_data.update({item['name']:0})
for city_data in item['children']:
total_heal_data[item['name']] +=int(city_data['total']['heal'])
print(total_heal_data)

# 解析新增确诊数据
total_new_data = {}
for item in num:
if item['name'] not in total_new_data:
total_new_data.update({item['name']:0})
for city_data in item['children']:
total_new_data[item['name']] +=int(city_data['today']['confirm']) # today
print(total_new_data)

#------------------------------------------------------------------------------
# 第二步:存储数据至CSV文件
#------------------------------------------------------------------------------
names = list(total_data.keys())          # 省份名称
num1 = list(total_data.values())         # 确诊数据
num2 = list(total_suspect_data.values()) # 疑似数据(全为0)
num3 = list(total_dead_data.values())    # 死亡数据
num4 = list(total_heal_data.values())    # 治愈数据
num5 = list(total_new_data.values())     # 新增确诊病例
print(names)
print(num1)
print(num2)
print(num3)
print(num4)
print(num5)

# 获取当前日期命名(2020-02-13-all.csv)
n = time.strftime("%Y-%m-%d") + "-all-4db.csv"
fw = open(n, 'w', encoding='utf-8')
fw.write('province,tpye,data\n')
i = 0
while i<len(names):
fw.write(names[i]+',confirm,'+str(num1[i])+'\n')
fw.write(names[i]+',dead,'+str(num3[i])+'\n')
fw.write(names[i]+',heal,'+str(num4[i])+'\n')
fw.write(names[i]+',new_confirm,'+str(num5[i])+'\n')
i = i + 1
else:
print("Over write file!")
fw.close()

#------------------------------------------------------------------------------
# 第三步:调用Seaborn绘制柱状图
#------------------------------------------------------------------------------
import time
import matplotlib
import numpy as np
import seaborn as sns
import pandas as pd
import matplotlib.pyplot as plt

# 读取数据
n = time.strftime("%Y-%m-%d") + "-all-4db.csv"
data = pd.read_csv(n)

# 设置窗口
fig, ax = plt.subplots(1,1)
print(data['province'])

# 设置绘图风格及字体
sns.set_style("whitegrid",{'font.sans-serif':['simhei','Arial']})

# 绘制柱状图
g = sns.barplot(x="province", y="data", hue="tpye", data=data, ax=ax,
palette=sns.color_palette("hls", 8))

# 设置Axes的标题
ax.set_title('全国疫情最新情况')

# 设置坐标轴文字方向
ax.set_xticklabels(ax.get_xticklabels(), rotation=-60)

# 设置坐标轴刻度的字体大小
ax.tick_params(axis='x',labelsize=8)
ax.tick_params(axis='y',labelsize=8)

plt.show()
此时绘制如下图所示:

但是当数据很小时,其柱状图无法很好地显示,建议采用以下方法处理:
- 归一化处理
- 湖北省外和湖北省内对比
# -*- coding: utf-8 -*-
#------------------------------------------------------------------------------
# 第三步:调用Seaborn绘制柱状图
#------------------------------------------------------------------------------
import time
import matplotlib
import numpy as np
import seaborn as sns
import pandas as pd
import matplotlib.pyplot as plt

# 读取数据
n = time.strftime("%Y-%m-%d") + "-all-4db-2no.csv"
data = pd.read_csv(n)

# 设置窗口
fig, ax = plt.subplots(1,1)
print(data['province'])

# 设置绘图风格及字体
sns.set_style("whitegrid",{'font.sans-serif':['simhei','Arial']})

# 绘制柱状图
g = sns.barplot(x="province", y="data", hue="tpye", data=data, ax=ax,
palette=sns.color_palette("hls", 8))

# 设置Axes的标题
ax.set_title('全国疫情最新情况')

# 设置坐标轴文字方向
ax.set_xticklabels(ax.get_xticklabels(), rotation=-60)

# 设置坐标轴刻度的字体大小
ax.tick_params(axis='x',labelsize=8)
ax.tick_params(axis='y',labelsize=8)

plt.show()
替换成新增确诊病例的对比图如下所示。

五.Seaborn绘制疫情趋势图及湖北省内外对比图
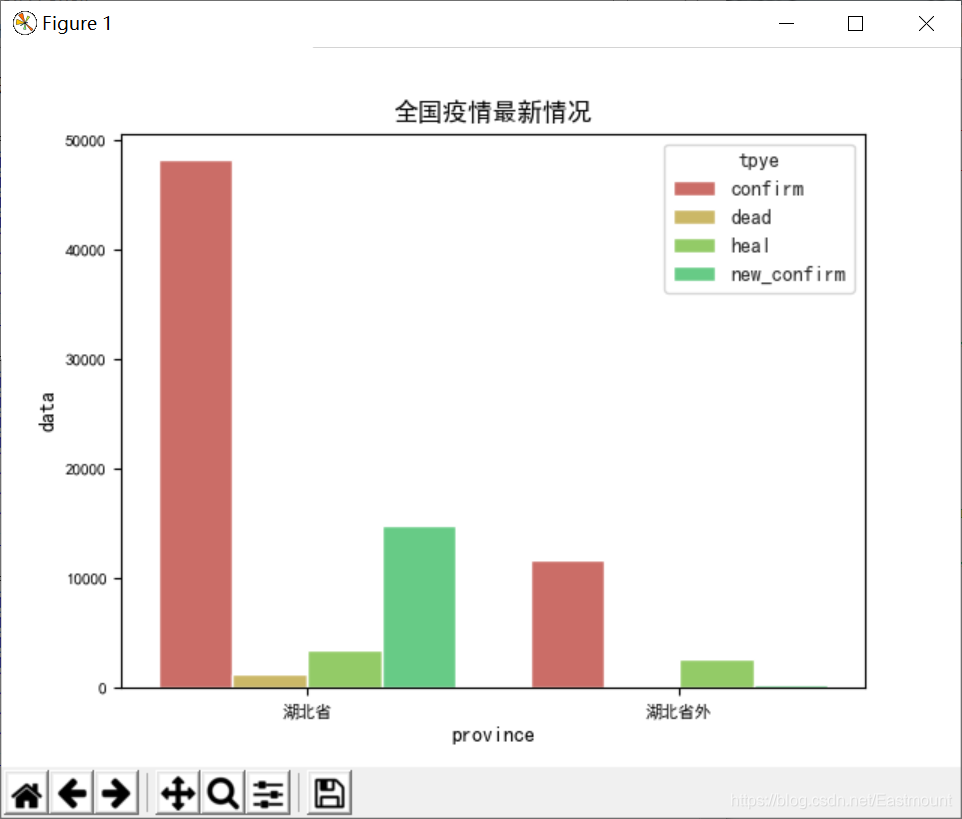
1.湖北省内外对比图
在做数据分析过程中,我们通常需要对数据进行预处理或加工,下面将数据划分为湖北省内和湖北省外,再绘制对应的对比图。

# -*- coding: utf-8 -*-
#------------------------------------------------------------------------------
# 第三步:调用Seaborn绘制柱状图
#------------------------------------------------------------------------------
import time
import matplotlib
import numpy as np
import seaborn as sns
import pandas as pd
import matplotlib.pyplot as plt

# 读取数据
data = pd.read_csv("2020-02-13-all-4db-2no.csv")

# 设置窗口
fig, ax = plt.subplots(1,1)
print(data['province'])

# 设置绘图风格及字体
sns.set_style("whitegrid",{'font.sans-serif':['simhei','Arial']})

# 绘制柱状图
g = sns.barplot(x="province", y="data", hue="tpye", data=data, ax=ax,
palette=sns.color_palette("hls", 8))

# 设置Axes的标题
ax.set_title('全国疫情最新情况')

# 设置坐标轴文字方向
ax.set_xticklabels(ax.get_xticklabels())

# 设置坐标轴刻度的字体大小
ax.tick_params(axis='x',labelsize=8)
ax.tick_params(axis='y',labelsize=8)

plt.show()
输出结果如下图所示:
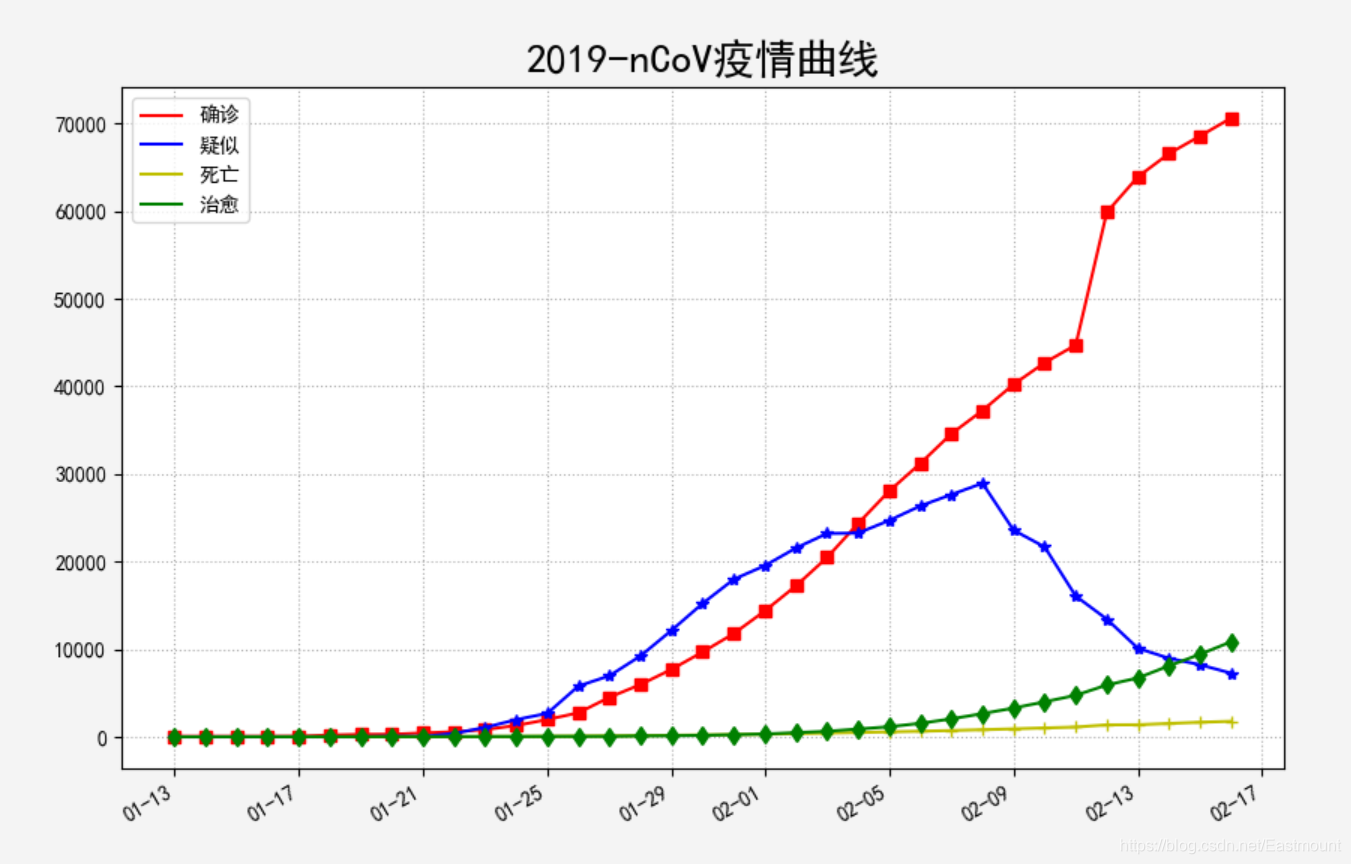
2.疫情趋势图
该部分代码是在许老师的文章基础上修改。
# -*- coding: utf-8 -*-
# 参考文章:许老师博客 https://www.geek-share.com/detail/2791598417.html
import time, json, requests
from datetime import datetime
import matplotlib.pyplot as plt
import matplotlib.dates as mdates

# 抓取腾讯疫情实时json数据
def catch_daily():
url = 'https://view.inews.qq.com/g2/getOnsInfo?name=wuwei_ww_cn_day_counts&callback=&_=%d'%int(time.time()*1000)
data = json.loads(requests.get(url=url).json()['data'])
data.sort(key=lambda x:x['date'])

date_list = list() # 日期
confirm_list = list() # 确诊
suspect_list = list() # 疑似
dead_list = list() # 死亡
heal_list = list() # 治愈
for item in data:
month, day = item['date'].split('/')
date_list.append(datetime.strptime('2020-%s-%s'%(month, day), '%Y-%m-%d'))
confirm_list.append(int(item['confirm']))
suspect_list.append(int(item['suspect']))
dead_list.append(int(item['dead']))
heal_list.append(int(item['heal']))
return date_list, confirm_list, suspect_list, dead_list, heal_list

# 绘制每日确诊和死亡数据
def plot_daily():

date_list, confirm_list, suspect_list, dead_list, heal_list = catch_daily() # 获取数据

plt.figure('2019-nCoV疫情统计图表', facecolor='#f4f4f4', figsize=(10, 8))
plt.title('2019-nCoV疫情曲线', fontsize=20)

plt.rcParams['font.sans-serif'] = ['SimHei']  #用来正常显示中文标签
plt.rcParams['axes.unicode_minus'] = False    #用来正常显示负号

plt.plot(date_list, confirm_list, 'r-', label='确诊')
plt.plot(date_list, confirm_list, 'rs')
plt.plot(date_list, suspect_list, 'b-',label='疑似')
plt.plot(date_list, suspect_list, 'b*')
plt.plot(date_list, dead_list, 'y-', label='死亡')
plt.plot(date_list, dead_list, 'y+')
plt.plot(date_list, heal_list, 'g-', label='治愈')
plt.plot(date_list, heal_list, 'gd')

plt.gca().xaxis.set_major_formatter(mdates.DateFormatter('%m-%d')) # 格式化时间轴标注
plt.gcf().autofmt_xdate() # 优化标注(自动倾斜)
plt.grid(linestyle=':') # 显示网格
plt.legend(loc='best') # 显示图例
plt.savefig('2019-nCoV疫情曲线.png') # 保存为文件
plt.show()

if __name__ == '__main__':
plot_daily()
输出结果如下图所示,疑似人数开始下降。武汉加油,中国必胜!
六.Seaborn绘制其他图形及分析
作者这里仅补充绘图语法,更多分析结果(死亡数-治愈数)请读者进行。同时,读者可以增加数据量,全国所有城市的数据,可能绘制的图形更为丰满。
参考作者前文:[知识图谱实战篇] 二.Json+Seaborn可视化展示电影实体
KDE图
sns.jointplot(x=“dead”, y=“heal”, data=data, kind=“kde”, space=0, color="#6AB27B")
# -*- coding: utf-8 -*-
#------------------------------------------------------------------------------
# 第四步:调用Seaborn绘制其他图形
#------------------------------------------------------------------------------
import time
import matplotlib
import numpy as np
import seaborn as sns
import pandas as pd
import matplotlib.pyplot as plt

# 读取数据
data = pd.read_csv('2020-02-13-all.csv')

plt.rcParams['font.sans-serif'] = ['SimHei']  #用来正常显示中文标签
plt.rcParams['axes.unicode_minus'] = False    #用来正常显示负号

# 设置窗口
fig, ax = plt.subplots(1,1)
print(data['province'])

# 设置Axes的标题
ax.set_title('全国疫情最新情况')

# 设置坐标轴刻度的字体大小
ax.tick_params(axis='x',labelsize=8)
ax.tick_params(axis='y',labelsize=8)

# 设置绘图风格及字体
sns.set_style("whitegrid",{'font.sans-serif':['simhei','Arial']})

# 六角形
#sns.jointplot(x="dead", y="heal", data=data, color="b", kind='hex')

# KDE 图
sns.jointplot(x="dead", y="heal", data=data, kind="kde", space=0, color="#6AB27B")

# 散点图+KDE 图
# g = (sns.jointplot(x="dead", y="heal", data=data, color="k").plot_joint(sns.kdeplot, zorder=0, n_levels=6))

plt.show()
显示如下图所示:

六角形
sns.jointplot(x=“dead”, y=“heal”, data=data, color=“b”, kind=‘hex’)

散点图
sns.jointplot(x=“dead”, y=“heal”, data=data, color=“b”, s=50, kind=‘scatter’, space = 0.1, size = 8, ratio = 5)

回归图
sns.jointplot(x=“dead”, y=“heal”, data=data, color=“b”, kind=‘reg’)
散点图+KDE 图
g = (sns.jointplot(x=“dead”, y=“heal”, data=data, color=“k”).plot_joint(sns.kdeplot, zorder=0, n_levels=6))

七.贵州省可视化分析
接着我们抓取某一个省的数据,比如贵州省。
# -*- coding: utf-8 -*-
#------------------------------------------------------------------------------
# 第一步:抓取数据
#------------------------------------------------------------------------------
import time, json, requests
# 抓取腾讯疫情实时json数据
url = 'https://view.inews.qq.com/g2/getOnsInfo?name=disease_h5&callback=&_=%d'%int(time.time()*1000)
data = json.loads(requests.get(url=url).json()['data'])
print(data)
print(data.keys())

# 统计省份信息(34个省份 湖北 广东 河南 浙江 湖南 安徽....)
num = data['areaTree'][0]['children']
print(len(num))

# 获取贵州下标
k = 0
for item in num:
print(item['name'],end=" ")   # 不换行
if item['name'] in "贵州":
print("")
print(item['name'], k)
break
k = k + 1
print("") # 换行

# 显示贵州省数据
gz = num[k]['children']
for item in gz:
print(item)
else:
print("\n")
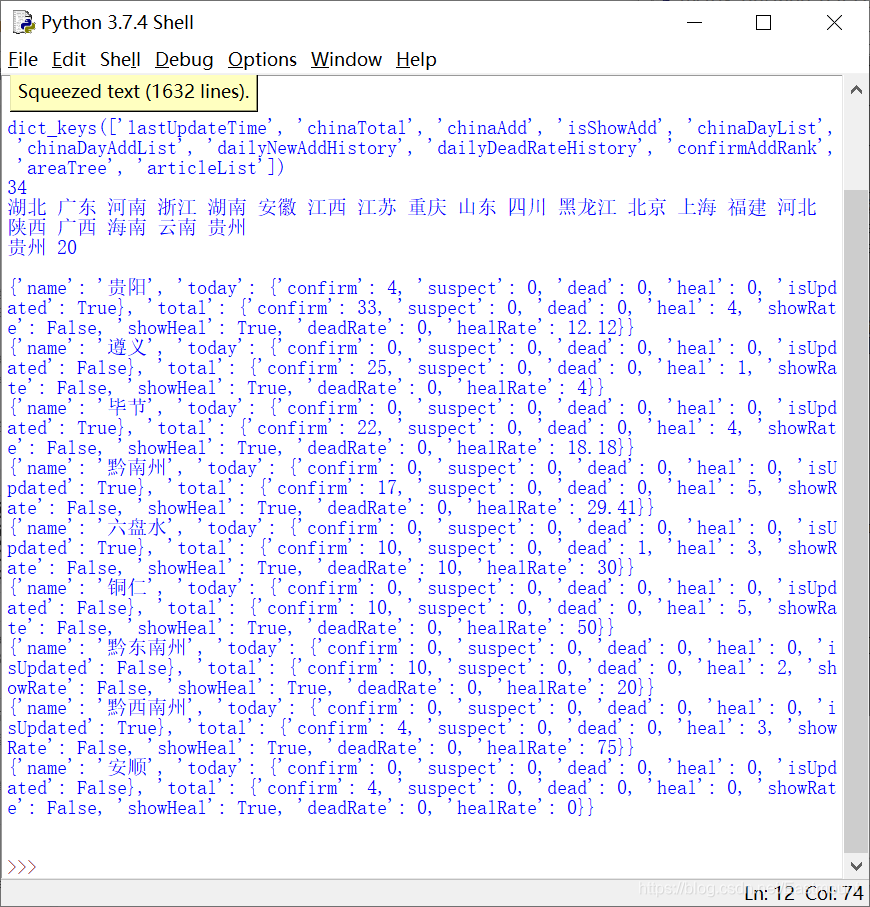
输出结果如下图所示:
添加解析数据和存储文件,完整代码如下:
# -*- coding: utf-8 -*-
#------------------------------------------------------------------------------
# 第一步:抓取数据
#------------------------------------------------------------------------------
import time, json, requests
# 抓取腾讯疫情实时json数据
url = 'https://view.inews.qq.com/g2/getOnsInfo?name=disease_h5&callback=&_=%d'%int(time.time()*1000)
data = json.loads(requests.get(url=url).json()['data'])
print(data)
print(data.keys())

# 统计省份信息(34个省份 湖北 广东 河南 浙江 湖南 安徽....)
num = data['areaTree'][0]['children']
print(len(num))

# 获取贵州下标
k = 0
for item in num:
print(item['name'],end=" ")   # 不换行
if item['name'] in "贵州":
print("")
print(item['name'], k)
break
k = k + 1
print("") # 换行

# 显示贵州省数据
gz = num[k]['children']
for item in gz:
print(item)
else:
print("\n")
#------------------------------------------------------------------------------
# 第二步:解析数据
#------------------------------------------------------------------------------
# 解析确诊数据
total_data = {}
for item in gz:
if item['name'] not in total_data:
total_data.update({item['name']:0})
total_data[item['name']] = item['total']['confirm']
print('确诊人数')
print(total_data)
# {'贵阳': 33, '遵义': 25, '毕节': 22, '黔南州': 17, '六盘水': 10, '铜仁': 10, '黔东南州': 10, '黔西南州': 4, '安顺': 4}

# 解析疑似数据
total_suspect_data = {}
for item in gz:
if item['name'] not in total_suspect_data:
total_suspect_data.update({item['name']:0})
total_suspect_data[item['name']] = item['total']['suspect']
print('疑似人数')
print(total_suspect_data)

# 解析死亡数据
total_dead_data = {}
for item in gz:
if item['name'] not in total_dead_data:
total_dead_data.update({item['name']:0})
total_dead_data[item['name']] = item['total']['dead']
print('死亡人数')
print(total_dead_data)

# 解析治愈数据
total_heal_data = {}
for item in gz:
if item['name'] not in total_heal_data:
total_heal_data.update({item['name']:0})
total_heal_data[item['name']] = item['total']['heal']
print('治愈人数')
print(total_heal_data)

# 解析新增确诊数据
total_new_data = {}
for item in gz:
if item['name'] not in total_new_data:
total_new_data.update({item['name']:0})
total_new_data[item['name']] = item['today']['confirm'] # today
print('新增确诊人数')
print(total_new_data)

#------------------------------------------------------------------------------
# 第三步:存储数据至CSV文件
#------------------------------------------------------------------------------
names = list(total_data.keys())          # 省份名称
num1 = list(total_data.values())         # 确诊数据
num2 = list(total_suspect_data.values()) # 疑似数据(全为0)
num3 = list(total_dead_data.values())    # 死亡数据
num4 = list(total_heal_data.values())    # 治愈数据
num5 = list(total_new_data.values())     # 新增确诊病例
print(names)
print(num1)
print(num2)
print(num3)
print(num4)
print(num5)

# 获取当前日期命名(2020-02-13-gz.csv)
n = time.strftime("%Y-%m-%d") + "-gz.csv"
fw = open(n, 'w', encoding='utf-8')
fw.write('province,confirm,dead,heal,new_confirm\n')
i = 0
while i<len(names):
fw.write(names[i]+','+str(num1[i])+','+str(num3[i])+','+str(num4[i])+','+str(num5[i])+'\n')
i = i + 1
else:
print("Over write file!")
fw.close()
完整输出内容如下所示:

dict_keys(['lastUpdateTime', 'chinaTotal', 'chinaAdd', 'isShowAdd', 'chinaDayList', 'chinaDayAddList', 'dailyNewAddHistory', 'dailyDeadRateHistory', 'confirmAddRank', 'areaTree', 'articleList'])
34
湖北 广东 河南 浙江 湖南 安徽 江西 江苏 重庆 山东 四川 黑龙江 北京 上海 福建 河北 陕西 广西 海南 云南 贵州
贵州 20

{'name': '贵阳', 'today': {'confirm': 4, 'suspect': 0, 'dead': 0, 'heal': 0, 'isUpdated': True}, 'total': {'confirm': 33, 'suspect': 0, 'dead': 0, 'heal': 4, 'showRate': False, 'showHeal': True, 'deadRate': 0, 'healRate': 12.12}}
{'name': '遵义', 'today': {'confirm': 0, 'suspect': 0, 'dead': 0, 'heal': 0, 'isUpdated': False}, 'total': {'confirm': 25, 'suspect': 0, 'dead': 0, 'heal': 1, 'showRate': False, 'showHeal': True, 'deadRate': 0, 'healRate': 4}}
{'name': '毕节', 'today': {'confirm': 0, 'suspect': 0, 'dead': 0, 'heal': 0, 'isUpdated': True}, 'total': {'confirm': 22, 'suspect': 0, 'dead': 0, 'heal': 4, 'showRate': False, 'showHeal': True, 'deadRate': 0, 'healRate': 18.18}}
{'name': '黔南州', 'today': {'confirm': 0, 'suspect': 0, 'dead': 0, 'heal': 0, 'isUpdated': True}, 'total': {'confirm': 17, 'suspect': 0, 'dead': 0, 'heal': 5, 'showRate': False, 'showHeal': True, 'deadRate': 0, 'healRate': 29.41}}
{'name': '六盘水', 'today': {'confirm': 0, 'suspect': 0, 'dead': 0, 'heal': 0, 'isUpdated': True}, 'total': {'confirm': 10, 'suspect': 0, 'dead': 1, 'heal': 3, 'showRate': False, 'showHeal': True, 'deadRate': 10, 'healRate': 30}}
{'name': '铜仁', 'today': {'confirm': 0, 'suspect': 0, 'dead': 0, 'heal': 0, 'isUpdated': False}, 'total': {'confirm': 10, 'suspect': 0, 'dead': 0, 'heal': 5, 'showRate': False, 'showHeal': True, 'deadRate': 0, 'healRate': 50}}
{'name': '黔东南州', 'today': {'confirm': 0, 'suspect': 0, 'dead': 0, 'heal': 0, 'isUpdated': False}, 'total': {'confirm': 10, 'suspect': 0, 'dead': 0, 'heal': 2, 'showRate': False, 'showHeal': True, 'deadRate': 0, 'healRate': 20}}
{'name': '黔西南州', 'today': {'confirm': 0, 'suspect': 0, 'dead': 0, 'heal': 0, 'isUpdated': True}, 'total': {'confirm': 4, 'suspect': 0, 'dead': 0, 'heal': 3, 'showRate': False, 'showHeal': True, 'deadRate': 0, 'healRate': 75}}
{'name': '安顺', 'today': {'confirm': 0, 'suspect': 0, 'dead': 0, 'heal': 0, 'isUpdated': False}, 'total': {'confirm': 4, 'suspect': 0, 'dead': 0, 'heal': 0, 'showRate': False, 'showHeal': True, 'deadRate': 0, 'healRate': 0}}

确诊人数
{'贵阳': 33, '遵义': 25, '毕节': 22, '黔南州': 17, '六盘水': 10, '铜仁': 10, '黔东南州': 10, '黔西南州': 4, '安顺': 4}
疑似人数
{'贵阳': 0, '遵义': 0, '毕节': 0, '黔南州': 0, '六盘水': 0, '铜仁': 0, '黔东南州': 0, '黔西南州': 0, '安顺': 0}
死亡人数
{'贵阳': 0, '遵义': 0, '毕节': 0, '黔南州': 0, '六盘水': 1, '铜仁': 0, '黔东南州': 0, '黔西南州': 0, '安顺': 0}
治愈人数
{'贵阳': 4, '遵义': 1, '毕节': 4, '黔南州': 5, '六盘水': 3, '铜仁': 5, '黔东南州': 2, '黔西南州': 3, '安顺': 0}
新增确诊人数
{'贵阳': 4, '遵义': 0, '毕节': 0, '黔南州': 0, '六盘水': 0, '铜仁': 0, '黔东南州': 0, '黔西南州': 0, '安顺': 0}
最后采用Seaborn绘制图形如下所示:
# -*- coding: utf-8 -*-
#------------------------------------------------------------------------------
# 第一步:抓取数据
#------------------------------------------------------------------------------
import time, json, requests
# 抓取腾讯疫情实时json数据
url = 'https://view.inews.qq.com/g2/getOnsInfo?name=disease_h5&callback=&_=%d'%int(time.time()*1000)
data = json.loads(requests.get(url=url).json()['data'])
print(data)
print(data.keys())

# 统计省份信息(34个省份 湖北 广东 河南 浙江 湖南 安徽....)
num = data['areaTree'][0]['children']
print(len(num))

# 获取贵州下标
k = 0
for item in num:
print(item['name'],end=" ")   # 不换行
if item['name'] in "贵州":
print("")
print(item['name'], k)
break
k = k + 1
print("") # 换行

# 显示贵州省数据
gz = num[k]['children']
for item in gz:
print(item)
else:
print("\n")
#------------------------------------------------------------------------------
# 第二步:解析数据
#------------------------------------------------------------------------------
# 解析确诊数据
total_data = {}
for item in gz:
if item['name'] not in total_data:
total_data.update({item['name']:0})
total_data[item['name']] = item['total']['confirm']
print('确诊人数')
print(total_data)
# {'贵阳': 33, '遵义': 25, '毕节': 22, '黔南州': 17, '六盘水': 10, '铜仁': 10, '黔东南州': 10, '黔西南州': 4, '安顺': 4}

# 解析疑似数据
total_suspect_data = {}
for item in gz:
if item['name'] not in total_suspect_data:
total_suspect_data.update({item['name']:0})
total_suspect_data[item['name']] = item['total']['suspect']
print('疑似人数')
print(total_suspect_data)

# 解析死亡数据
total_dead_data = {}
for item in gz:
if item['name'] not in total_dead_data:
total_dead_data.update({item['name']:0})
total_dead_data[item['name']] = item['total']['dead']
print('死亡人数')
print(total_dead_data)

# 解析治愈数据
total_heal_data = {}
for item in gz:
if item['name'] not in total_heal_data:
total_heal_data.update({item['name']:0})
total_heal_data[item['name']] = item['total']['heal']
print('治愈人数')
print(total_heal_data)

# 解析新增确诊数据
total_new_data = {}
for item in gz:
if item['name'] not in total_new_data:
total_new_data.update({item['name']:0})
total_new_data[item['name']] = item['today']['confirm'] # today
print('新增确诊人数')
print(total_new_data)

#------------------------------------------------------------------------------
# 第三步:存储数据至CSV文件
#------------------------------------------------------------------------------
names = list(total_data.keys())          # 省份名称
num1 = list(total_data.values())         # 确诊数据
num2 = list(total_suspect_data.values()) # 疑似数据(全为0)
num3 = list(total_dead_data.values())    # 死亡数据
num4 = list(total_heal_data.values())    # 治愈数据
num5 = list(total_new_data.values())     # 新增确诊病例
print(names)
print(num1)
print(num2)
print(num3)
print(num4)
print(num5)

# 获取当前日期命名(2020-02-13-gz.csv)
n = time.strftime("%Y-%m-%d") + "-gz-4db.csv"
fw = open(n, 'w', encoding='utf-8')
fw.write('province,type,data\n')
i = 0
while i<len(names):
fw.write(names[i]+',confirm,'+str(num1[i])+'\n')
fw.write(names[i]+',dead,'+str(num3[i])+'\n')
fw.write(names[i]+',heal,'+str(num4[i])+'\n')
fw.write(names[i]+',new_confirm,'+str(num5[i])+'\n')
i = i + 1
else:
print("Over write file!")
fw.close()

#------------------------------------------------------------------------------
# 第四步:调用Seaborn绘制柱状图
#------------------------------------------------------------------------------
import time
import matplotlib
import numpy as np
import seaborn as sns
import pandas as pd
import matplotlib.pyplot as plt

# 读取数据
n = time.strftime("%Y-%m-%d") + "-gz-4db.csv"
data = pd.read_csv(n)

# 设置窗口
fig, ax = plt.subplots(1,1)
print(data['province'])

# 设置绘图风格及字体
sns.set_style("whitegrid",{'font.sans-serif':['simhei','Arial']})

# 绘制柱状图
g = sns.barplot(x="province", y="data", hue="type", data=data, ax=ax,
palette=sns.color_palette("hls", 8))

# 设置Axes的标题
ax.set_title('贵州2月13日疫情最新情况')

# 设置坐标轴文字方向
ax.set_xticklabels(ax.get_xticklabels(), rotation=-60)

# 设置坐标轴刻度的字体大小
ax.tick_params(axis='x',labelsize=8)
ax.tick_params(axis='y',labelsize=8)

plt.show()
贵州省2月13日疫情显示结果如下所示:

八.总结
写到这里,第一篇疫情分析的文章就讲解完毕,希望对您有所帮助。主要包括两部分内容:
- 实时数据爬取
- 可视化分析
后续还会分享GIS地图显示、情感分析、舆情分析、主题挖掘、威胁情报溯源、知识图谱、预测预警及AI和NLP应用等。如果文章对您有所帮助,将是我写作的最大动力。
同时,向钟院士致敬,向一线工作者致敬。侠之大者,为国为民。咱们中国人一生的最高追求,为天地立心,为生民立命,为往圣继绝学,为万世开太平。以一人之力系万民康乐,以一身犯险保大业安全。他们真是做到了,武汉加油,中国加油!

(By:Eastmount 2020-02-17 晚上9点夜于贵阳 http://blog.csdn.net/eastmount/)
参考文献:
[1] https://news.qq.com/zt2020/page/feiyan.htm
[2] Python实战:抓肺炎疫情实时数据,画2019-nCoV疫情地图 - 许老师-
[3] 用Python抓新型冠状病毒肺炎疫情数据,绘制全国疫情分布图 - shineych老师
[4] 2020Python开发者日:爬虫框架的技术实现与模块应用的经验分享 - 许老师
[5] [知识图谱实战篇] 二.Json+Seaborn可视化展示电影实体
- 点赞 4
- 收藏
- 分享
- 文章举报
 Eastmount
博客专家
发布了426 篇原创文章 · 获赞 5373 · 访问量 454万+
他的留言板
关注
Eastmount
博客专家
发布了426 篇原创文章 · 获赞 5373 · 访问量 454万+
他的留言板
关注

- Java使用POI导出大数据量Excel的方法
- MyPaint 2.0 发布,开源绘图工具
- 12306 抢票系列之只要搞定RAIL_DEVICEID的来源,从此抢票不再掉线(上)
- 工业狗转行AI的心路历程
- 12306 抢票系列之只要搞定RAIL_DEVICEID的来源,从此抢票不再掉线(中)
- 【阿里云IoT+YF3300】14.阿里IoT Studio打造手机端APP
- kail wifi
- su root的时候报错su: authentication failed
- 云计算浅谈之一:云计算介绍
- Foxmail发送邮件,发送邮件工具类
- HDFS JavaAPI简单实例
- Hadoop-2.6.0-cdh5.7.0安装详解
- Hadoop-2.6.0-cdh5.7.0安装详解
- hdfs命令
- 前端常见面试题:js六大数据类型
- 复工一周,中国经济怎么样?看大数据给出的答案
- Hadoop中ip:50070不能访问的问题
- MySQL大数据量分页性能优化
- NB-IoT通信模组DTU电路板
- 基于STM32L431单片机和NB-IOT技术的低功耗追踪器