使用prometheus文件服务发现,监控虚拟机
2020-02-13 03:18
423 查看
利用prometheus文件服务发现功能,可以方便自定义主机或虚拟机的监控。
1. /etc/prometheus/prometheus.yml配置文件
文件服务发现配置参考 job_name: 'vm' 段
# my global config
global:
scrape_interval:     15s # Set the scrape interval to every 15 seconds. Default is every 1 minute.
evaluation_interval: 15s # Evaluate rules every 15 seconds. The default is every 1 minute.
# scrape_timeout is set to the global default (10s).

# Attach these labels to any time series or alerts when communicating with
# external systems (federation, remote storage, Alertmanager).
external_labels:
monitor: 'codelab-monitor'

# Load rules once and periodically evaluate them according to the global 'evaluation_interval'.
rule_files:
# - "first.rules"
# - "second.rules"

# A scrape configuration containing exactly one endpoint to scrape:
# Here it's Prometheus itself.
scrape_configs:
# The job name is added as a label `job=<job_name>` to any timeseries scraped from this config.
- job_name: 'prometheus'

# metrics_path defaults to '/metrics'
# scheme defaults to 'http'.

static_configs:
- targets: ['localhost:9090']

scrape_configs:
- job_name: 'vm'
file_sd_configs:
- files:
- /etc/prometheus/files/vm.yml
refresh_interval: 5s
2. /etc/prometheus/files/vm.yml配置文件内容
[
{
"targets": [ "192.168.1.6:9273"],
"labels": {
"hosttype": "vm"
}
}
]
3. 通过docker启动prometheus
docker run -d  -p 9090:9090 \
-v /etc/prometheus/prometheus.yml:/etc/prometheus/prometheus.yml \
-v /etc/prometheus/files:/etc/prometheus/files \
prom/prometheus:v1.8.2
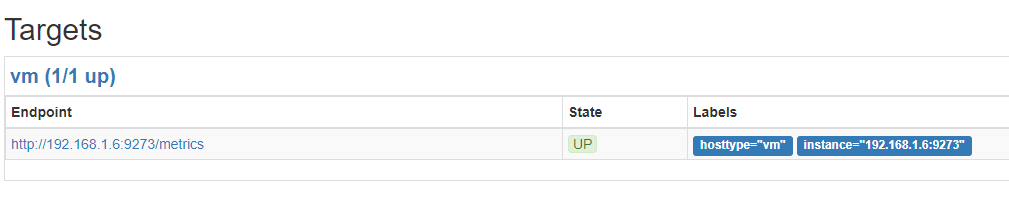
4. 检查prometheus的target,是否包含files.yml文件中配置的target
http://192.168.1.6:9090/targets
5. 动态生成/etc/prometheus/files.yml
如果想动态修改target,可以通过http请求,获取主机列表,然后动态生成/etc/prometheus/files/vm.yml文件。
下面是动态生成vm.yml例子。通过http请求,获取虚拟机的ip地址列表,然后动态生成vm.yml文件。
#!/usr/bin/python

import json
import logging
import os
import requests
import time

logging.basicConfig(level=logging.INFO,
format='%(asctime)s %(filename)s[line:%(lineno)d] %(levelname)s %(message)s',
datefmt='%Y-%m-%d %H:%M:%S',
filename='/var/log/prometheus-vm-http.log',
filemode='w')

console = logging.StreamHandler()
console.setLevel(logging.INFO)
formatter = logging.Formatter('%(name)-12s: %(levelname)-8s %(message)s')
console.setFormatter(formatter)
logging.getLogger('').addHandler(console)

def refresh():
url = "http://域名/api/vm/ip"
resp = requests.get(url, timeout=10)
if resp.status_code == 200:
logging.info("get " + url + " ok")

data = [
{
"targets": map(lambda x: x + ":9273", resp.json()),
"labels": {
"hosttype": "vm"
}
}
]

with open('/etc/prometheus/files/vm.yml.new', 'w') as f:
json.dump(data, f, indent=2)
f.flush()
os.fsync(f.fileno())

os.rename('/etc/prometheus/files/vm.yml.new', '/etc/prometheus/files/vm.yml')

else:
logging.error("get " + url + " failed. status_code=%d, resp=%s" % (resp.status_code, resp.text))

if __name__ == '__main__':
while True:
try:
refresh()
except Exception, e:
logging.error(e)

time.sleep(10)
转载于:https://my.oschina.net/u/1263909/blog/1600916
- 点赞
- 收藏
- 分享
- 文章举报
 chuji9291
发布了0 篇原创文章 · 获赞 0 · 访问量 435
私信
关注
chuji9291
发布了0 篇原创文章 · 获赞 0 · 访问量 435
私信
关注

相关文章推荐
- 使用prometheus文件服务发现,监控虚拟机
- 使用windows服务和.NET FileSystemWatcher对象来监控磁盘文件目录的改变
- 使用一体化监控系统监控云操作系统虚拟机中的MySQL数据库服务
- 使用Prometheus监控bind9的DNS服务
- 使用windows服务和.NET FileSystemWatcher对象来监控磁盘文件目录的改变
- zabbix使用宏自动发现挂载的文件系统并进行监控
- 市面上所有号称"虚拟机","防火墙"的实时监控杀毒软件无一不是使用的IFSHOOK技术.但是同时也有一些朋友不断写MAIL给我打听如何实现读写的监控.下面给出用VTOOLSD写的代码.也就是所有实时杀毒软件的奥秘.同时,很多拦截文件操作的软件,例如对目录加
- 使用 UDDI 的 Web 服务描述和发现(第一部分)
- Ubuntu下使用Simba服务实现局域网内文件共享
- 用C#开发Windows服务监控系统使用
- 使用 inotify 监控 Linux 文件系统事件
- 用C#开发Windows服务监控系统使用
- WCF系列(一) -- 完全不使用配置文件构建和使用WCF服务
- 使用shell脚本进行服务器系统监控——文件系统监控(2)
- [原创] 使用Perl实现系统服务监控和报警
- COM(VB/VBA/Script)利用服务标记调用WCF服务之四:使用配置文件
- 使用 inotify 监控 Linux 文件系统事件
- SQL脚本:监控当前重做日志文件使用情况
- 使用.NET FileSystemWatcher对象监控磁盘文件目录的改变
- 关于IIS服务启动失败的问题:“IIS提示‘另一个程序正在使用此文件,进程无法访问’”,的解决方法