idea 在debug时遇见启动非常慢的情况,Method breakpoints may dramatically slow down debugging的解决与剖析
2019-07-29 14:33
2471 查看
版权声明:本文为博主原创文章,遵循 CC 4.0 by-sa 版权协议,转载请附上原文出处链接和本声明。
本文链接:https://blog.csdn.net/qq_39830532/article/details/97640584
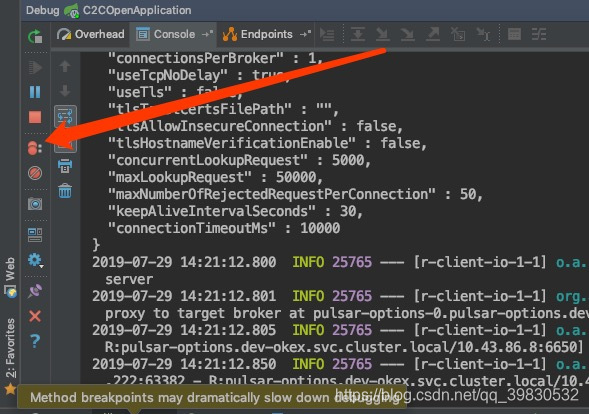
有时候打断点进行debug的时候,会出现这样的情况,启动的特别慢,甚至启动不起来。后来经过各种努力检查最后发现是断点打在了方法上。
解决办法:
打开debug界面并点击如下图所示:
就可以看见自己打得所有断点:

圆形红点中有四个点的就是打在方法上的断点
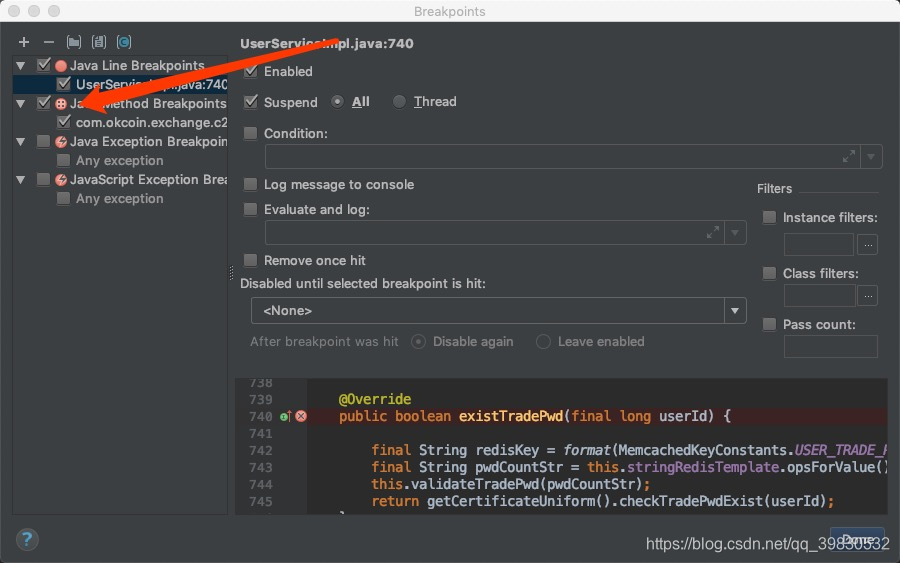
双击这个方法就可以快速定位到这里,取消掉它就可正常启动debug了。
出现的原因
- 为什么会出现这样的情况呢? 方法上不能打断点吗
是因为JVM的设计,方法断点会大大减慢调试器的速度。所以说想要debug的快,尽量避免方法断点。
Debugger performance can be affected by the following:
- Method breakpoints will slow down debugger a lot because of the JVM design, they are expensive to evaluate. Remove method breakpoints and consider using the regular line breakpoints. To verity that you don’t have any method breakpoints open .idea/workspace.xml file in the project root directory (or .iws file if you are using the old project format) and look for any breakpoints inside the method_breakpoints node.
- Watch method return values option is enabled in the Debugger Panel. Try disabling this option to improve the performance.
- Enable alternative views for Collections classes and Enable toString()’ object view options enabled in Settings | Debugger | Data Views. If toString() methods take a long time to complete, disable this option. Note that custom toString() methods can also change the semantics of the application when running under debugger in case the code inside these methods changes the state of your application.
- Memory tab in the debugger toolwindow. It is updated on every debugger stop, try to minimize it to improve stepping performance.
详情可参考:
https://intellij-support.jetbrains.com/hc/en-us/articles/206544799-Java-slow-performance-or-hangups-when-starting-debugger-and-stepping

相关文章推荐
- idea启动tomcat服务DEBUG的时候出现Method breakpoints may dramatically slow down debugging
- IDEA调试:Method breakpoints may dramatically slow down debugging
- InterlliJ Debug方式启动:Method breakpoints may dramatically slow down debugging
- InterlliJ Debug方式启动:method breakpoints may dramatically show down debugging
- InterlliJ Debug方式启动:Method breakpoints may dramatically slow down debugging
- InterlliJ Debug方式启动:Method breakpoints may dramatically slow down debugging
- InterlliJ Debug方式启动:Method breakpoints may dramatically slow down debugging
- Method breakpoints may dramatically slow down debugging
- Idea: Method breakpoints my dramatically slow down debugging
- InterlliJ Debug方式启动:method breakpoints may dramatically show down debugging
- InterlliJ Debug方式启动:method breakpoints may dramatically show down debugging
- InterlliJ调试:Method breakpoints may dramatically slow down debugging
- InterlliJ Debug方式启动:method breakpoints may dramatically show down debugging
- Intellij idea:Method breakpoints my dramatically slow down debugging
- Intellij idea断点 Debugger slow: Method breakpoints my dramatically slow down debugging
- Intellij idea:Method breakpoints my dramatically slow down debugging
- 解决weblogic Managed Server启动非常慢的情况
- IntelliJ IDEA Tomcat Debug启动非常慢,系统运行非常慢
- Weblogic :解决Managed Server启动非常慢的情况
- 解决tomcat在debug模式下启动非常慢的问题