Matlab实现 通过检测QR二维码位置探测图案进行精确定位
近邻点集融合算法
QR二维码结构简介
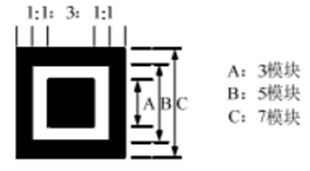
QR二维码识别中在对图像预处理后最重要的一步就是要进行定位,QR二维码中有三个位置探测图形,通过扫描其特征便可以进行精细定位。

其中位置探测图形的比例特征如下:
本文介绍的方法用于在二维码经过图像预处理并已经粗定位二维码大致位置后,检测位置探测图案坐标以精确定位。
首先要做的是,横竖扫描图像像素,找到满足黑白黑白黑且比例关系近似1:1:3:1:1的,将其两端的中点坐标记录下来,最终得到整幅图像所有的候选点,代码附在文末。
效果如图:

下一步使用原创的近邻点融合算法筛选出真正的位置探测图形所在位置的点。
近邻点融合
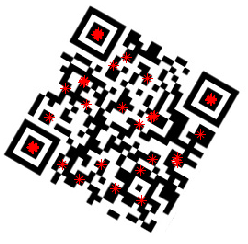
1、搜索每个点附近一定距离内近邻点的数量,用每个点近邻点集的平均坐标代替原本的坐标:这样可以将比较集中的点的集群向内收缩融合,孤立点由于没有紧邻点则会直接删除,在不停的迭代中其他零散的点的紧邻点减少的速度会远远大于三个位置探测图形所在位置相对更集中的点。
融合效果如左图,右图是每个近邻点集求出平均坐标后的效果。
2、当得到的近邻点集数量小于某个值时(默认定为20)或者迭代次数到达预设的最大迭代次数(10),结束迭代。
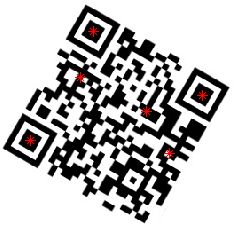
3、筛选出拥有紧邻点最多的三个点,求出其平均坐标就是三个位置探测图形所在的坐标了。
效果如图:

后续只需要通过判断这三个点的位置关系,对图像进行校正即可。
更新:
使用400张左右的二维码图片进行测试,其中包含了不同方向不同角度,以上方法得到的定位准确率仅有70%不到,因此算法仍需优化。
思考后加入了一个反馈机制,对于得到的三个坐标进行计算,判断其各种位置关系是否是真正的三个位置探测图形,若计算结果发现位置关系差别较大,则对近邻点融合算法的参数进行调整重新融合,经过测试,准确率可以提高到90%以上,相关代码已更新。
QR二维码精定位算法:
%横竖扫描图像像素,找到满足黑白黑白黑且比例关系近似1:1:3:1:1的,
%将其两端的中点坐标记录下来,最终得到整幅图像所有的候选点,
%然后下一步筛选出真正的位置探测图形所在位置的点。
%紧邻点融合算法:
%1、搜索每个点附近一定距离内近邻点的数量,用
%每个点近邻点集的平均坐标代替原本的坐标:这样可以将比较集中的点
%的集群向内收缩融合,孤立点由于没有紧邻点则会直接删除,在不停的
%迭代中其他零散的点的紧邻点减少的速度会远远大于三个位置探测图形
%所在位置相对更集中的点。
%2、当拥有近邻点集的点数量小于某个值时(默认定为20)或者
%迭代次数到达预设的最大迭代次数时结束迭代。
%3、筛选出拥有紧邻点最多的三个点,求出其平均坐标就是三个
%位置探测图形所在的坐标了。
%4、判断得到的三个点坐标是否是正确的三个位置探测图形位置,
%若不是,则调整参数进行二次计算,直到判断通过。

function points = detect(img)
clc;close all;
[m, n,~] = size(img);
tol = 5; %初始距离阈值

points = findInRowAndCol(img); %横纵像素扫描,找到拥有1:1:3:1:1比例的位置

% tol = 4;
iterate =10; %最大迭代次数
num = 0;
itnum = 0;
numMax = 30; %结束迭代条件,小于numMax个点则结束

for i = 1:iterate
[num, points,numRepeat] = Points_merge(tol,points); %近邻点融合函数
itnum = itnum + 1;
if(num < numMax)  %小于numMax个点集结束迭代
break;
end
end

% 排序,前三个即为紧邻点数量最多的三个点
for i = 1:num-1
for j = i:num
if(numRepeat(i) < numRepeat(j))
temp = numRepeat(i);
numRepeat(i) = numRepeat(j);
numRepeat(j) = temp;
temp1 =  points(i,1);
points(i,1) =  points(j,1);
points(j,1) = temp1;
temp2 =  points(i,2);
points(i,2) =  points(j,2);
points(j,2) = temp2;
end
end
end

%反馈,若三点不满足一定条件则进行二次计算重新定位
count = 0;  %计算重复定位次数
Feedback = detectFeedback(points);
if(Feedback == 0)
points = dectectAgain1(img, tol, numMax, count)
end

%画出拥有近邻点集做多的前三个点的平均坐标
for index = 1:3
x(index) = points(index,1);
y(index) = points(index,2);
end
figure(1);
subplot(1,1,1);
imshow(img);
hold on
for index = 1:3
plot(y(index),x(index),'*r');
end
grid on
扫描1:1:3:1:1位置探测图案的代码:
%横、纵两个方向扫描图像像素,找到满足黑白黑白黑且
%比例关系近似1:1:3:1:1的,将其两端的中点坐标记录下来,
%最终得到整幅图像所有的候选点。

function pointAll = findInRowAndCol()
clear;close all;clc;
f = imread('test.jpg');
k=graythresh(f);
img=im2bw(f,k);
img = 255*img;

[rows, cols] = size(img);

skipRows = 1;
currentState = 0;
pointRow = [];
pointCol = [];
% C = [];

%横向扫描
for row = 1:skipRows:rows
stateCount(1) = 0; % 占比为1的黑色像素
stateCount(2) = 0; % 占比为1的白色像素
stateCount(3) = 0; % 占比为3的黑色像素
stateCount(4) = 0; % 占比为1的白色像素
stateCount(5) = 0; % 占比为1的黑色像素
currentState = 1;  % 模块属性计数器(黑色像素模块/白色像素模块)

ptr_row = img(row,:);

for col = 1:cols
if(ptr_row(col) < 128)
%该像素为黑色
if(mod(currentState, 2) == 0)
%若当前计数器为白色模块计数器,将其转入下一级计数器即黑色模块计数器
currentState = currentState + 1;
end
stateCount(currentState) = stateCount(currentState) + 1;
else
%该像素为白色
if(mod(currentState, 2) == 0)
%若当前计数器为白色模块计数器,将其转入下一级计数器即黑色模块计数器
stateCount(currentState) = stateCount(currentState) + 1;
else
if(currentState == 5)
%在最后一个黑色模块计数器后出现了一个白色像素,即已经获取了黑 白 黑 白 黑的连续像素片段
%需要开始通过1:1:3:1:1判断前5个模块是否是位置探测图形的特征
[check,totalFinderSize] = QRcheckRatio(stateCount);%判断是否符合1:1:3:1:1
%                      C = [C,check];
if(check == 1)
%满足比例,记入
x = row;
y = col - totalFinderSize/2;
pointRow = [pointRow;[x,y]];
currentState = 1;
stateCount(1) = 0;
stateCount(2) = 0;
stateCount(3) = 0;
stateCount(4) = 0;
stateCount(5) = 0;
else
% 不满足比例,继续扫描
currentState = 4;
stateCount(1) = stateCount(3);
stateCount(2) = stateCount(4);
stateCount(3) = stateCount(5);
stateCount(4) = 1;
stateCount(5) = 0;
end
else
% 不是最后一个黑色模块计数器5
% 转换为白色模块计数器
currentState = currentState + 1;
stateCount(currentState) = stateCount(currentState) + 1;
end
end
end
end
end

%纵向扫描
for col = 1:skipRows:cols
stateCount(1) = 0; % 占比为1的黑色像素
stateCount(2) = 0; % 占比为1的白色像素
stateCount(3) = 0; % 占比为3的黑色像素
stateCount(4) = 0; % 占比为1的白色像素
stateCount(5) = 0; % 占比为1的黑色像素
currentState = 1;  % 模块属性计数器(黑色像素模块/白色像素模块)

ptr_col = img(:,col);

for row = 1:rows
if(ptr_col(row) < 128)
%该像素为黑色
if(mod(currentState, 2) == 0)
%若当前计数器为白色模块计数器,将其转入下一级计数器即黑色模块计数器
currentState = currentState + 1;
end
stateCount(currentState) = stateCount(currentState) + 1;
else
%该像素为白色
if(mod(currentState, 2) == 0)
%若当前计数器为白色模块计数器,将其转入下一级计数器即黑色模块计数器
stateCount(currentState) = stateCount(currentState) + 1;
else
if(currentState == 5)
%在最后一个黑色模块计数器后出现了一个白色像素,即已经获取了黑 白 黑 白 黑的连续像素片段
%需要开始通过1:1:3:1:1判断前5个模块是否是位置探测图形的特征
[check,totalFinderSize] = QRcheckRatio(stateCount);%判断是否符合1:1:3:1:1
if(check)
x = row - totalFinderSize/2;
y = col;
pointCol = [pointCol;[x,y]];
currentState = 1;
stateCount(1) = 0;
stateCount(2) = 0;
stateCount(3) = 0;
stateCount(4) = 0;
stateCount(5) = 0;
else
% 不满足比例,继续扫描
currentState = 4;
stateCount(1) = stateCount(3);
stateCount(2) = stateCount(4);
stateCount(3) = stateCount(5);
stateCount(4) = 1;
stateCount(5) = 0;
end
else
% 不是最后一个黑色模块计数器5
% 转换为白色模块计数器
currentState = currentState + 1;
stateCount(currentState) = stateCount(currentState) + 1;
end
end
end
end
end

%画点
pointAll = [pointRow; pointCol];
x = pointAll(:,1);
y = pointAll(:,2);
subplot(1,1,1)
imshow(img);
hold on
plot(y,x,'*r');
grid on
其中判断是否满足比例关系的函数代码如下:
function [bool,totalFinderSize] = QRcheckRatio(stateCount)

totalFinderSize = 0;
for i = 1:5
count = stateCount(i);
totalFinderSize = totalFinderSize +  count;
if(count == 0)
bool = false;
end
end
if(totalFinderSize<7)
bool = false;
end
moduleSize = ceil(totalFinderSize / 7); % 单个模块平均宽度

%计算比例 1:1:3:1:1
tol_factor = 0.5; %用于判断比例的误差系数
maxVar
20000
iance = moduleSize*tol_factor;
retVal = ((abs(moduleSize - (stateCount(1)))< maxVariance) &&...
(abs(moduleSize - (stateCount(2)))< maxVariance) &&...
(abs(3*moduleSize - (stateCount(3)))< 3*maxVariance) &&...
(abs(moduleSize - (stateCount(4)))< maxVariance) &&...
(abs(moduleSize - (stateCount(5)))< maxVariance));

bool = retVal;
扫描结果如图:

近邻点集融合算法代码如下:
%紧邻点融合
%搜索每个点附近一定距离内近邻点的数量,用每个点近邻点集
%的平均坐标代替原本的坐标,比较集中的点的集群将会向内
%收缩融合,孤立点直接删除。

function [num1, points,numRepeat] = Points_merge(tol, points)
clc;close all;

tol_distance = tol;
[num, ~] = size(points);
xgroup = [];
ygroup = [];
score(1:num) = 0;
xgroup(1:num) = 0;
ygroup(1:num) = 0;

%删除重叠点
for i = 1:num-1
for j = i+1:num
if(points(i,1) == points(j,1) && points(i,2) == points(j,2))
points(i,1) = 0;
points(i,2) = 0;
end
end
end

%距离较近的点记入近邻点集,用以求平均
for i = 1:num
for j = 1:num
distance = sqrt((points(i,1)-points(j,1))*(points(i,1)-points(j,1))+...
(points(i,2)-points(j,2))*(points(i,2)-points(j,2)));
if (distance < tol_distance)
score(i) = score(i) + 1;
%将相近点的坐标相加,为后续求平均距离做准备
xgroup(i) = xgroup(i) + points(j,1);
ygroup(i) = ygroup(i) + points(j,2);
end
end
end

%计算每个点的平均坐标,并用其替换掉原本的点坐标
for i = 1:num
points(i,1)= xgroup(i)/ score(i);
points(i,2)= ygroup(i)/ score(i);
if(score(i) == 1)
points(i,1)= 0;
points(i,2)= 0;
end
end

%通过上一步计算的平均坐标 合并拥有相同坐标的点,即拥有相同近邻点集的点
numRepeat(1:num) = 1; %记录近邻点集数量的计数器
k = 0;
for i = 1:num-1  %将重复项化为零
if(points(i,1)~= 0 && points(i,2)~=0)%遇到非零点计数器才会加一
k = k+1;
end
for j = i+1 : num
if(points(i,1) == points(j,1) && points(i,2) == points(j,2) ...
&& points(i,1)~= 0 && points(i,2)~=0)
numRepeat(k) = numRepeat(k)+1;
points(j,1)= 0;%坐标相同的点清为零,等下一步将其剔除
points(j,2)= 0;
end
end
end
%非零项往前移,将零项往后移
i = 1;
while i ~= num
if (points(i,1) == 0 && points(i,2) == 0)
for index = i:num-1
points(index,1) = points(index+1,1);
points(index,2) = points(index+1,2);
points(num,1) = 0;
points(num,2) = 0;
end
else
i = i + 1;
end
%判断是否已将所有非零项和零项分开
is = issort(points);
if(is)
i = num;
end
end

%非零项的数量
num1 = 0;
for i = 1:num
if (points(i,1) ~= 0 || points(i,2) ~= 0)
num1 = num1 + 1;
end
end

% %画点
% img = imread('rotate.jpg');
% for index = 1:num1
%     x(index) = points(index,1);
%     y(index) = points(index,2);
% end
% figure
% subplot(1,1,1)
% imshow(img);
% hold on
% for index = 1:num1
%     plot(y(index),x(index),'*r');
% end
% grid on

end
其中判断是否已将所有非零项和零项分开的函数代码如下:
%判断所有非零点和零点是否已经被分开

function is = issort(points)

[num,~] = size(points);

for i = 1:num
if (points(i,1) == 0 && points(i,2) == 0)
for k = i+1:num
if (points(k,1) ~= 0 || points(k,2) ~= 0)
is = 0;
return;
end
if(k == num)
is = 1;
return;
end
end
elseif (i == num)
is = 1;
return;
end
end
判断得到的三个点是否是正确的三个位置探测图形坐标:
function Feedback = detectFeedback(points)

Feedback = 1;
result = 1;
point1 = points(1,:); %取三点
point2 = points(2,:);
point3 = points(3,:);
vector12 = point2 - point1; %求向量,区分正负
vector21 = point1 - point2;
vector23 = point3 - point2;
vector32 = point2 - point3;
vector13 = point3 - point1;
vector31 = point1 - point3;
length1 = norm(vector12); %三条边长
length2 = norm(vector23);
length3 = norm(vector31);
%三边夹角
angle1 = 180/pi * acos(dot(vector12, vector13)/(norm(vector12)* norm(vector13)));
angle2 = 180/pi * acos(dot(vector23, vector21)/(norm(vector23)* norm(vector21)));
angle3 = 180/pi * acos(dot(vector31, vector32)/(norm(vector31)* norm(vector32)));

%条件
%三边长度差距不能过大,设定为不得超过2.5倍
if(length1 < length2/2.5 || length1 < length3/2.5 || ...
length2 < length1/2.5 || length2 < length3/2.5 || ...
length3 < length1/2.5 || length3 < length2/2.5)
result = 0;
%三边夹角不得过大,经实验设定为120度
elseif(angle1 > 120 || angle2 > 120 || angle3 > 120)
result = 0;
%点在x方向上距离较近时的情况进行排除,
%该情况下三点几乎呈现等边三角形并且x坐标值距离较近
elseif(angle1 < 70 && angle2 < 70 && angle3 < 70 &&...
(abs(point1(2)-point2(2)) > length1/3.5 &&...
abs(point2(2)-point3(2)) > length2/3.5 &&...
abs(point1(2)-point3(2)) > length3/3.5))
result = 0;
end

%最终判断
if(result == 0)
Feedback = 0;
end
二次计算循环块1
function points = dectectAgain1(img, tol, numMax, count)
clc;close all;
count = count + 1; %重复定位次数增加一次

points = findInRowAndCol(img); %横纵像素扫描,找到拥有1:1:3:1:1比例的位置

tol = tol + count;     %初始距离阈值
iterate =10; %最大迭代次数
num = 0;
itnum = 0;
numMax = numMax + 2; %结束迭代条件,小于numMax个点则结束

for i = 1:iterate
[num, points,numRepeat] = Points_merge(tol,points); %近邻点融合函数
itnum = itnum + 1;
if(num < numMax)  %小于numMax个点集结束迭代
break;
end
end

% 排序,前三个即为紧邻点数量最多的三个点
for i = 1:num-1
for j = i:num
if(numRepeat(i) < numRepeat(j))
temp = numRepeat(i);
numRepeat(i) = numRepeat(j);
numRepeat(j) = temp;
temp1 =  points(i,1);
points(i,1) =  points(j,1);
points(j,1) = temp1;
temp2 =  points(i,2);
points(i,2) =  points(j,2);
points(j,2) = temp2;
end
end
end

%反馈
Feedback = detectFeedback(points);
if(Feedback == 0 && tol > 1)
points = dectectAgain2(img, tol, numMax, count);
end
二次计算循环块2
function points = dectectAgain2(img, tol, numMax, count)
clc;close all;
count = count + 1; %重复定位次数增加一次

points = findInRowAndCol(img); %横纵像素扫描,找到拥有1:1:3:1:1比例的位置

tol = tol - count;     %初始距离阈值
iterate =10; %最大迭代次数
num = 0;
itnum = 0;
numMax = numMax + 2; %结束迭代条件,小于numMax个点则结束

for i = 1:iterate
[num, points,numRepeat] = Points_merge(tol,points); %近邻点融合函数
itnum = itnum + 1;
if(num < numMax)  %小于numMax个点集结束迭代
break;
end
end

% 排序,前三个即为紧邻点数量最多的三个点
for i = 1:num-1
for j = i:num
if(numRepeat(i) < numRepeat(j))
temp = numRepeat(i);
numRepeat(i) = numRepeat(j);
numRepeat(j) = temp;
temp1 =  points(i,1);
points(i,1) =  points(j,1);
points(j,1) = temp1;
temp2 =  points(i,2);
points(i,2) =  points(j,2);
points(j,2) = temp2;
end
end
end

%反馈
Feedback = detectFeedback(points);
if(Feedback == 0 && tol > 1)
points = dectectAgain1(img, tol, numMax, count);
end
以上均为个人学习所得,欢迎分享交流。
本文参考: https://www.geek-share.com/detail/2635536020.html

- 图像进行Sobel算子、Hough变换检测圆的matlab实现
- AutoIT: 如何通过坐标相对位置来对无法识别的Menu以及GridView进行定位点击操作
- 通过软件忙等进行精确延时的实现
- 高精度UWB定位系统,实现位置精确管理!
- 基于肤色和眼睛定位的人脸检测算法——MATLAB实现【转】
- 囧,还可以这样玩,通过GPS实现定位手机号所在位置的系统
- 求助!用openlayers如何实现读入数据库的地理位置信息,然后进行实时同步定位??万分感谢!
- 基于肤色和眼睛定位的人脸检测算法——MATLAB实现
- web app实现基站定位获取精确地理位置的一种简单方法
- (转)css 相对定位 绝对定位 浮动 CSS 相对定位 相对定位是一个非常容易掌握的概念。如果对一个元素进行相对定位,它将出现在它所在的位置上。然后,可以通过设置垂直或水平位置,让这个元素“相对于”
- 刻度标尺精确定位系统-更为人性化的位置检测系统
- matlab实现MSER(最大极值稳定区域)来进行文本定位
- matlab实现MSER(最大极值稳定区域)来进行文本定位
- matlab实现MSER(最大极值稳定区域)来进行文本定位
- 图像边缘检测经典算子及MATLAB实现
- 通过git的webhook实现通过钉钉进行代码及时review(Java版本)
- stm32f103 学习笔记 —— 03 通过IDR循环检测实现按键检测
- js锁屏解屏通过对$.ajax进行封装实现
- (转)通过文件读写方式实现Matlab和Modelsim的联合仿真
- Android笔记之高德地图定位(通过开启服务发送广播用handle消息机制更新位置信息)