OpenCV3与深度学习实例-使用OpenPose进行人体姿态估算
2018-09-12 11:46
711 查看
import cv2
import time
import numpy as np
import matplotlib.pyplot as plt
import os

# Load a Caffe Model

if not os.path.isdir('model'):
os.mkdir("model")

protoFile = "datas/models/caffe/openpose/pose_deploy_linevec_faster_4_stages.prototxt"
weightsFile = "datas/models/caffe/openpose/pose_iter_160000.caffemodel"

# Specify number of points in the model
nPoints = 15
POSE_PAIRS = [[0,1], [1,2], [2,3], [3,4], [1,5], [5,6], [6,7], [1,14], [14,8], [8,9], [9,10], [14,11], [11,12], [12,13] ]
net = cv2.dnn.readNetFromCaffe(protoFile, weightsFile)

# Read Image
im = cv2.imread("datas/images/man.jpg")
im = cv2.cvtColor(im, cv2.COLOR_BGR2RGB)
inWidth = im.shape[1]
inHeight = im.shape[0]

# Convert image to blob
netInputSize = (368, 368)
inpBlob = cv2.dnn.blobFromImage(im, 1.0 / 255, netInputSize, (0, 0, 0), swapRB=True, crop=False)
net.setInput(inpBlob)

# Run Inference (forward pass)
output = net.forward()

# Display probability maps
plt.figure(figsize=(20,10))
plt.title('Probability Maps of Keypoints')
for i in range(nPoints):
probMap = output[0, i, :, :]
displayMap = cv2.resize(probMap, (inWidth, inHeight), cv2.INTER_LINEAR)
plt.subplot(3, 5, i+1); plt.axis('off'); plt.imshow(displayMap, cmap='jet')

# Extract points

# X and Y Scale
scaleX = float(inWidth) / output.shape[3]
scaleY = float(inHeight) / output.shape[2]

# Empty list to store the detected keypoints
points = []

# Confidence treshold
threshold = 0.1

for i in range(nPoints):
# Obtain probability map
probMap = output[0, i, :, :]

# Find global maxima of the probMap.
minVal, prob, minLoc, point = cv2.minMaxLoc(probMap)

# Scale the point to fit on the original image
x = scaleX * point[0]
y = scaleY * point[1]

if prob > threshold :
# Add the point to the list if the probability is greater than the threshold
points.append((int(x), int(y)))
else :
points.append(None)

# Display Points & Skeleton

imPoints = im.copy()
imSkeleton = im.copy()
# Draw points
for i, p in enumerate(points):
cv2.circle(imPoints, p, 8, (255, 255,0), thickness=-1, lineType=cv2.FILLED)
cv2.putText(imPoints, "{}".format(i), p, cv2.FONT_HERSHEY_SIMPLEX, 1, (255,0,0), 2, lineType=cv2.LINE_AA)

# Draw skeleton
for pair in POSE_PAIRS:
partA = pair[0]
partB = pair[1]

if points[partA] and points[partB]:
cv2.line(imSkeleton, points[partA], points[partB], (255, 255,0), 2)
cv2.circle(imSkeleton, points[partA], 8, (255, 0, 0), thickness=-1, lineType=cv2.FILLED)

plt.figure(figsize=(20,10))
plt.subplot(121); plt.axis('off'); plt.imshow(imPoints);
#plt.title('Displaying Points')
plt.subplot(122); plt.axis('off'); plt.imshow(imSkeleton);
#plt.title('Displaying Skeleton')
plt.show()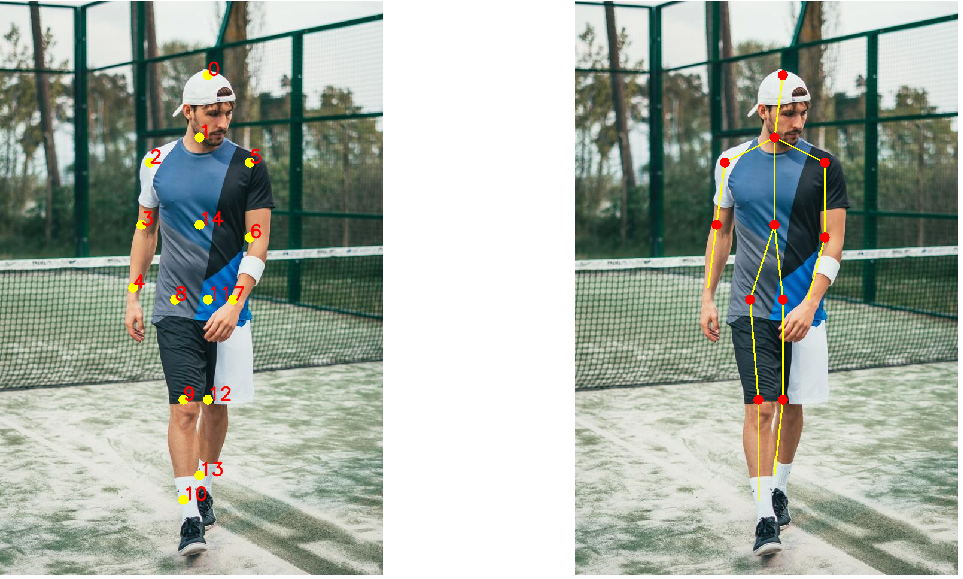

相关文章推荐
- OpenCV3与深度学习实例-使用YOLOV3进行物体检测
- OpenCV3与深度学习实例-使用GoogLeNet模型进行图片分类识别
- OpenCV3与深度学习实例-使用SSD Inception模型进行物体检测
- 使用亚马逊AWS云服务器进行深度学习——免环境配置/GPU支持/Keras/TensorFlow/OpenCV
- 深度学习Caffe平台实例——CIFAR-10数据集在caffe平台上模型训练及实例使用模型进行预测
- 使用torch进行深度学习
- 通过使用VSRS3.5+opencv2.4.9进行深度图和彩色图的虚拟视点绘制
- 通过使用VSRS3.5+opencv2.4.9进行深度图和彩色图的虚拟视点绘制
- 【转载】使用theano进行深度学习实践(一) - CSDN博客
- AWS上使用MXNet进行分布式深度学习
- 深度学习笔记之使用Faster-Rcnn进行目标检测 (原理篇)
- 【神经网络与深度学习】【Qt开发】【VS开发】从caffe-windows-visual studio2013到Qt5.7使用caffemodel进行分类的移植过程
- 深度学习笔记之使用Faster-Rcnn进行目标检测 (实践篇)
- 使用BigDL在Apache Spark上进行大规模分布式深度学习 [session]
- 《Towards Viewpoint Invariant 3D Human Pose Estimation》--深度图领域人体姿态估计的CNN算法
- Python OpenCV学习笔记之:使用Grabcut算法进行图像背景和前景分割
- 使用theano进行深度学习实践(一)
- Turtlebot学习指导第四篇_使用robot_pose_ekf包,EKF(扩展卡尔曼滤波器)对机器人位置进行校正
- opencv中3D点根据相机参数投影成2D点+solvePnP函数计算相机姿态+2D坐标到3D+相机参数calibration(标定与配准,求得深度彩色相机的内参与外参,再进行配准)
- java struts2入门学习实例--使用struts进行验证